Download
1 / 18
180 likes | 315 Views
Optimization Model Demonstration:. The Westfield River Basin. Dr. David Ahlfeld Professor of Civil and Environmental Engineering. KVL. LVL. WOR. WSHP. BOR. CMT. Westfield River Basin Review. KVL = Knightville (Flood Control) LVL = Littleville (Flood Control)

E N D
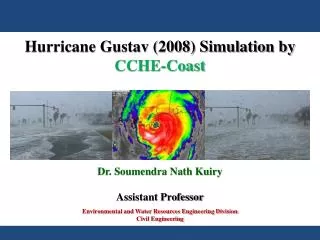
Optimization Model Demonstration: The Westfield River Basin Dr. David Ahlfeld Professor of Civil and Environmental Engineering
KVL LVL WOR WSHP BOR CMT Westfield River Basin Review KVL = Knightville (Flood Control) LVL = Littleville (Flood Control) BOR = Borden Brook (Drinking) CMT = Cobble Mountain (Drinking/Hydro) WOR = Woronoco (Hydro) WSHP = West Springfield Hydro Project (Hydro) = Ecological Point of Interest
Why Optimize? • Improve current reservoir operations to increase efficiency • Increase hydropower production, increase water supply reliability, decrease flood risk, etc. • Introduce ecological flows to operations • Optimization models will examine how altering operating policies can improve ecological flows while maintaining or improving current reservoir objectives • Plan for the future (Later Presentation) • Short/long term forecasting and climate change
Our Optimization Model The optimization model calculates releases on a daily time step for each reservoir. Releases are the DECISION VARIABLES Storages are calculated from the Releases: Storage at end of day = Storage at end of prior day + Inflow during the day – Releases during the day Natural inflows to reservoirs are assumed known.
Model Constraints The model releases are bounded by CONSTRAINTS • Example Constraints: • Release Upper Bound • Release Through Turbine ≤ Turbine Capacity • Reservoir connectivity • Assume Reservoir A flows to Reservoir B • Storage of Reservoir B = Prev. Storage at B + Inflows to B + Outflows from A – Releases from B • Reservoir Storage Capacity • Reservoir Storage ≤ Reservoir Capacity
Model Objective Function The optimization model selects releases to maximize or minimize a given objective THE OBJECTIVE FUNCTION Example Objective Functions for River Systems: Maximize Income from Hydropower Generation Maximize Available water for municipal use Minimize Deviations from a target storage Minimize Deviations from an ecological flow
Targets vs. Constraints • Constraints • Cannot be violated • If the model cannot be satisfy the constraints the problem is infeasible Example Reservoir Storage ≤ 50K acre-ft • The storage must be less than or equal to 50K acre-ft • LINGO will report an infeasible result • Targets • Can be violated • Penalize the objective function as deviation from the target increases. Example Deviation from Release Target = Actual Release – Target Minimum Release • The objective function minimizes the deviation below the target
The Westfield River Optimization Model • Objective Function: • Minimize deviations from target storages for KVL, LVL, and CMT. • Minimize deviations from minimum release targets for KVL and LVL. • Minimize flow over flood target point • Maximize power for CMT, WOR, and WSHP • Constraints • Reservoir Connectivity (i.e. Storage at WOR = Previous Day’s Storage + Releases from KVL, LVL, CMT + Inflow to WOR – Releases from WOR) • Reservoir capacities for all reservoirs • Turbine capacities for CMT, WOR, WSHP • Ramping and release constraints on reservoir releases – produces more realistic hydrograph (limits the unrealistic release spikes) The optimization model is solved with LINGO which communicates with an Excel spreadsheet to read inputs (inflows) and output the releases and resulting storages.
Multiple Objectives and Trade-Offs Minimize = Deviations from Target Storages at LVL and KVL + Deviations from Target Storages at CMT + Deviations above the Flood Check Points + Deviations below Min. Flow Targets at LVL and KVL + Income from CMT power generation + - Income from WOR power generation + - Income from WSHP power generation + Weight 1* Weight 2* Weight 3* Weight 4* Weight 5* Weight 6* Weight 7* To prioritize an objective, increase it’s respective weight. Develop Trade-Off Curves: Run the model several times, each time changing the objective function weights.
Now, let’s examine some results and trade-offs from theWestfield River • Begin with analysis of Cobble Mountain (CMT) • 70,000 acre-ft reservoir that supplies water to Springfield. • 30.6 MW generating capacity – withdrawals to drinking water facility run through turbine and any water released back to the river runs through turbine. The trade-off: How much additional hydropower income can be obtained by relaxing the reservoir’s target volume Vary the weights on CMT Storage and CMT Hydropower
Cobble Mountain: Target Storage vs. Hydropower Income Let’s examine this point Each point on the curve represents an operating policy. Little increase in income for less reservoir reliability For example, this point says if the operations keep the reservoir at target storage 99% of the time, the income is $1.7M per year
Releases and Storages for Selected Point Releases to River Storages
Scenario: Minimum Instream Flow Requirements for Cobble Mountain The optimization model lets us examine the trade-off between Cobble Mountain water supply and an instream flow requirement Each point on the trade-off curve represents the optimal operating policy for that minimum instream flow.
Cobble Mountain Instream Flow Trade-Off As expected, it is harder for Cobble Mountain to maintain its storage target with increasing instream flow requirements
Instead of focusing on one reservoir, now let’s see how the optimization model can jointly optimize individual reservoirs for a downstream target The optimization model will use these 5 reservoirs to hit the ecological target downstream.
Downstream Ecological Target The 2-yr 10-day flow event: The 10 day flow event that is expected to occur every 2 years. Average flow of 4,500 cfs for 10 days • The Best Way Achieve This Flow Event • Use the available storage in the flood control dams to store water for the target. • Only use Cobble Mountain Drinking water if necessary To do this in the optimization model, heavily weight (or prioritize) CMT target storage over LVL and KVL. This will use the flood control storage first.
Flood Control Trade-Off CMT storage remained constant at each scenario. Drinking water supply not needed for ecological flow