Download
1 / 18
180 likes | 192 Views
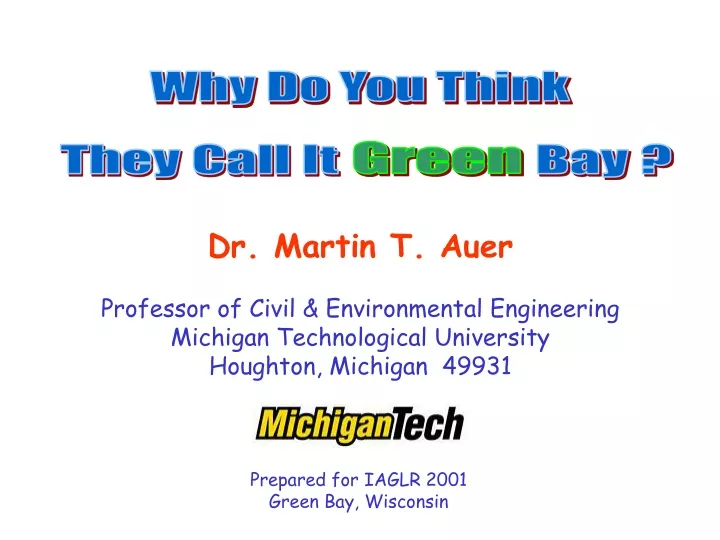
Why Do You Think. Green. They Call It Bay ?. Dr. Martin T. Auer Professor of Civil & Environmental Engineering Michigan Technological University Houghton, Michigan 49931. Prepared for IAGLR 2001 Green Bay, Wisconsin. 10. 8. 150. 6. 120. 4. 90. 2. 60.

E N D
Why Do You Think Green They Call It Bay ? Dr. Martin T. Auer Professor of Civil & Environmental Engineering Michigan Technological University Houghton, Michigan 49931 Prepared for IAGLR 2001 Green Bay, Wisconsin
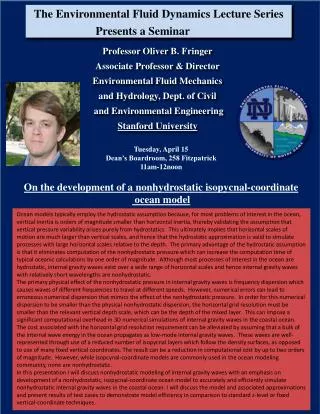
10 8 150 6 120 4 90 2 60 120 100 0 30 0 20 40 60 80 120 100 0 120 0 20 40 60 80 0 100 5 80 10 60 15 40 20 20 100 120 0 25 0 40 60 80 20 120 100 30 80 0 20 40 60 Water Quality Gradients TP (µgP/L) Quota (P, %POC) Photic Chl (µg/L) Aphotic Bottom Distance from Fox River Mouth (km)
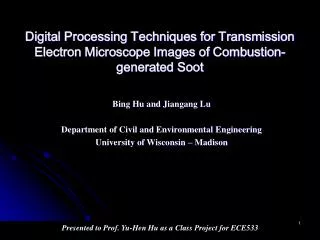
100 Summer Minimum D.O. Sat. (%) 80 60 40 20 0 0-1 1-2 0 40 80 20 60 100 120 2-3 Distance (km) > 3 SOD (gO2• m-2• d-1) Dissolved Oxygen Gradient
The Silo Index 3 6 0
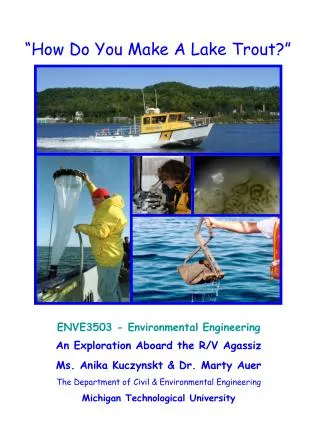
TP Contributions Point Sources 35% Non Point Sources 65%
Land Use Soil Texture Non Point Source Model TP UALs TP Load Trophic State Water Quality Model A Modeling Approach
Soil Texture Soil Texture Area UAL Land Use Land Use Non Point Model Lower Fox, River Lakes, and Lake Winnebago Watersheds
Water Quality Model dP × = - × + × - - × × V W Q P E ' ( P P ) V k P adj dt Empirical Relations for Trophic State = ƒ (Total P)
So ... Why They Call It Bay ? Do Green LaSalle The Griffon
Acknowledgements Ray Canale Anita Barth Eye Larry Londo Tom Heidtke Bob Gardiner Dennis Rosnowski Mark Kieser Bob Schuurmans Auer, M.T. and R.P. Canale. 1986. Mathematical modeling of primary production in Green Bay (Lake Michigan, USA): A phosphorus and light‑limited system. Hydrobiological Bulletin, 20(2): 195‑211. Auer, M.T., Kieser, M.S., and R.P. Canale. 1986. Identification of critical nutrient levels through field verification of models for phosphorus and phytoplankton growth. Canadian Journal of Fisheries and Aquatic Sciences, 43(2): 379‑388. Canale, R.P. and M.T. Auer. 1987. Personal computers and environmental engineering. Environmental Science and Technology, 21(10): 936‑942. Heidtke, T.M., Auer, M.T. and R.P. Canale. 1986. Microcomputer models and water quality: Access for decision‑makers. Journal of the Water Pollution Control Federation, 58(10): 960‑966. Funded by U.S. EPA MED, Duluth, Minnesota