Download
1 / 1
40 likes | 176 Views
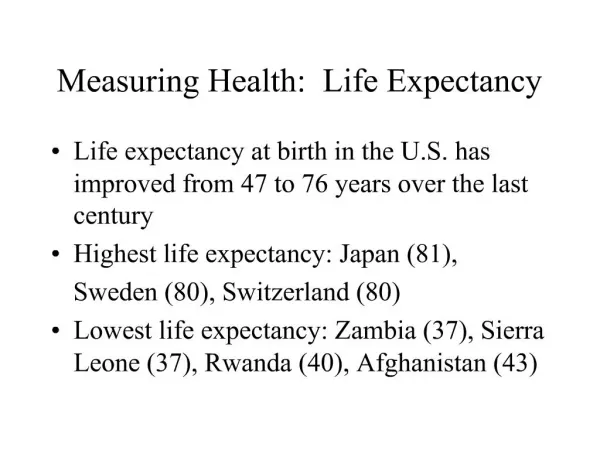
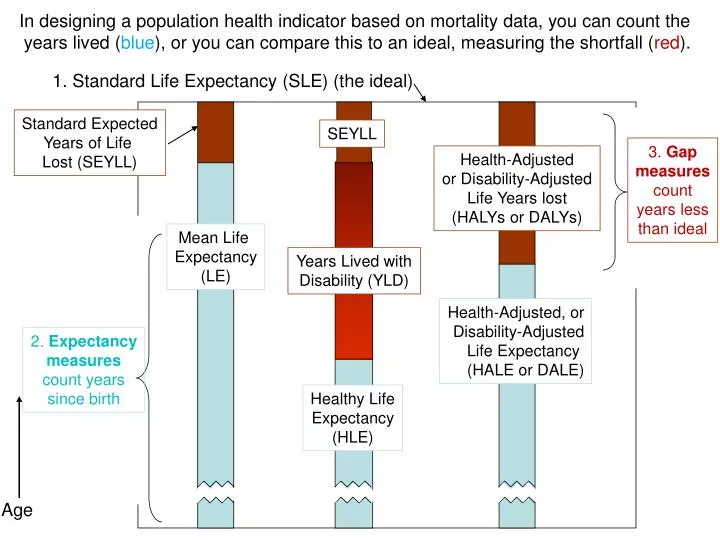
Age. In designing a population health indicator based on mortality data, you can count the years lived ( blue ), or you can compare this to an ideal, measuring the shortfall ( red ). . 1. Standard Life Expectancy (SLE) (the ideal). Standard Expected Years of Life Lost (SEYLL). SEYLL.

E N D
Age In designing a population health indicator based on mortality data, you can count the years lived (blue), or you can compare this to an ideal, measuring the shortfall (red). 1. Standard Life Expectancy (SLE) (the ideal) Standard ExpectedYears of Life Lost (SEYLL) SEYLL 3. Gapmeasurescountyears lessthan ideal Health-Adjustedor Disability-AdjustedLife Years lost(HALYs or DALYs) Mean Life Expectancy(LE) Years Lived withDisability (YLD) Health-Adjusted, orDisability-AdjustedLife Expectancy (HALE or DALE) 2. Expectancymeasurescount yearssince birth Healthy LifeExpectancy(HLE)