Download
1 / 22
240 likes | 384 Views
Disability free Life Expectancy. Carol Jagger University of Leicester EHEMU Team. European Population Day: Ageing IUSSP Tours 2005. Purpose.

E N D
Disability free Life Expectancy Carol Jagger University of Leicester EHEMU Team European Population Day: Ageing IUSSP Tours 2005
Purpose • To explore compression or expansion of disability and gender differences through cross-national comparisons of disability-free life expectancy (DFLE) at birth and age 65 among 14 EU countries between 1995 and 2003 • In preparation for new EU structural indicator Healthy Life Years
Data and methods Estimation of DFLE and 95% CI, using Sullivan method • age specific probability of death: Eurostat life tables • age specific disability prevalence: European Community Household Panel 1995-2001 question ‘Are you hampered in your daily activities by any physical or mental health problem, illness or disability? ‘
Distribution of LE and DFLE at birth EU(14), 1995-2003 Women Men LE
Distribution of LE and DFLE at birth EU(14), 1995-2003 Women Men LE DFLE
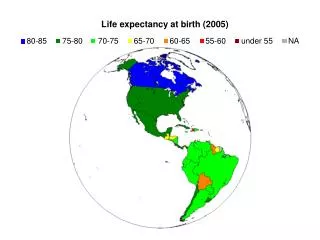
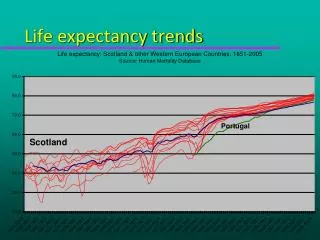
Distribution of LE and DFLE at birth EU(14), 1995-2003 • By 2003 LE at birth in the EU14 ranged from 74.2 (Portugal) to 78 (Sweden) years for men and 80.1 (Denmark) to 83.2 years (France) for women, following a steady increase from 1995. • Compared to LE, trends in DFLE were more variable although gender differences were smaller • Between 1995-2003 the gain in total years for men exceeded the gain in years free of disability • In women there was only a slight improvement, on average, in life expectancy with a similar gain in disability-free life years.
What about life expectancy and disability free life expectancy at older ages?
Trends in proportion of life spent disability-free at age 65 Men = gain of 5% + = gain or loss of less than 5% = loss of 5% +
Trends in proportion of life spent disability-free at age 65 Women = gain of 5% + = gain or loss of less than 5% = loss of 5% +
Men Austria, Belgium, Finland, Germany Italy, Spain France, Greece, Ireland, Netherlands, Portugal Denmark, Sweden, UK Women Italy,Sweden Austria, Belgium, Denmark, Finland, France, Spain, UK Germany, Greece, Ireland, Netherlands, Portugal Trends in the proportion of life spent disability-free at age 65
Trends in LE and DFLE using the ECHP • Life expectancy: • Small variation in LE between these 14 MS • Increase between 1995-2003 • Disability Free Life Expectancy and %DFLE/LE • Large variation in DFLE between these 14 MS • Diverging trends over 1995-2003: reduction / stagnation / increase in the proportion of life with reported disability at age 65 while LE increases • Gender differences in trends
Real or artefact? May be artefact due to • Data problems • Sampling • Omission of institutionalised population • Not harmonised disability question • Cultural differences in reporting of disability • Confounding factors – socio-economic But trends less sensitive to these If real what is ‘cause’
Data and Methods • Problems in both • mortality and ECHP data • 1) Data base • Probable data errors • Replacement with other sources • Missing • 2) Interruption of data collection • No data for 2002 and 2003 • Solutions • 1) Data base • Linear imputation of age specific probabilities (death and disability) • Shift of the prevalence trend to the ECHP level • Imputation of data according to observed trends • 2) Interruption of data collection • Linear extrapolation of the disability prevalence
Real or artefact? May be artefact due to • Data problems • Sampling • Omission of institutionalised population • Not harmonised disability question • Cultural differences in reporting of disability • Confounding factors – socio-economic But trends less sensitive to these If real what is ‘cause’
Models of the disablement process Disease>Impairment>Functional limitation>Disability (Nagi, 1965,1976, 1991) Disease>Impairment>Functional limitation>Activity Restriction>Handicap (Wood, 1975) Disease>Impairment>Disability>Handicap (ICIDH, 1980)
Gain in TLE and DFLE without prevalent disease (MRC CFAS) MEN age 65
Prevalence of all dementias by studySource: Lobo et al. (2000) = Finland; = Sweden; = Denmark; = Rotterdam; –= UK (MRC-ALPHA); = UK (Melton Mowbray);= France;+ = Italy; = Spain (Zaragoza Study); = Spain (Pamplona Study); x = Spain (ZARADEMP).
Age-specific incidence of first stroke per 100000 men* *standardised to European population
Conclusions • Population aging has a different impact in the 14 Member States in Europe: • different levels of reported disability (larger dispersion than LE) • variation in the magnitude of the gender difference • different trends over time • Need to further document cross-national differences in self-reported disability with regard to: • improved harmonisation of the instruments • using different levels of severity • documenting differences in reporting • documenting differences in selection in the panel
Disability free Life Expectancy Carol Jagger University of Leicester EHEMU Team France-Europe Day IUSSP Tours 2005