Download
1 / 20
200 likes | 221 Views
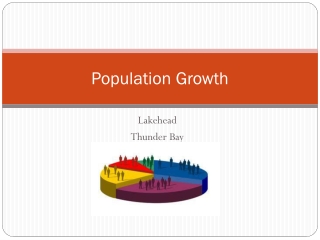
Population Growth. An increase in the number of individuals in a population. Unlimited resources and reproduction lead to population growth (G). Growth = Births – Deaths (G = B – D)

E N D
Population Growth • An increase in the number of individuals in a population Unlimited resources and reproduction lead to population growth (G) Growth = Births – Deaths (G = B – D) During the 1990s, the United States experienced high levels of immigration, which contributed to slow population increase. The birth, fertility, and death rates did not change substantially during this decade. Emigration, when people leave their home country to move elsewhere, was also low during this decade
Resources Disease Organism interaction Habitat Size/Crowding Weather When a population overshoots the carrying capacity, then limiting factors may come into effect. Growth Limitations A limiting factor is something that limits population growth. Food, water, and living space are all examples of limiting factors. Without access to these resources, populations cannot grow and eventually decline
Carrying Capacity The number of organisms of one species that an environment can support indefinitely. Carrying capacity is the maximum population size that an environment can support. In general, populations increase when they are below the carrying capacity because there are plenty of resources available for the entire population. However, populations decrease when they are above carrying capacity because resources are not available for everyone
Population Growth When births exceed deaths you see population growth. J-Shaped Curve Measuring the doubling time of a population requires that the growth rate be constant over long periods of time
Exponential growth means that as a population gets larger, it also grows at a faster rate. Exponential Growth J-Shaped Curve In the United States women had fewer children in 1995 than in 1955, which is the baby boom era. Also, women are having children later in life; there is a clear shift from women having children in their early twenties in 1955 to women having children in their early thirties in 1995
Density - Dependent • Density-dependent factors include disease, competition, predators, parasites, and food. • Disease, for example, can spread more quickly in a population with members that live close together.
Density - Independent • Density-independent factors can affect all populations, regardless of their density. • Most density-independent factors are abiotic factors, such as temperature, storms, floods, drought, and major habitat disruption
Rapid life-history patterns are common among organisms from changeable or unpredictable environments. Reproduction Patterns:Rapid life-history patterns A baby boom is a sharp population increase that reflects a period of peace and prosperity. In general, fertility rates decrease when women seek higher levels of education and competitive jobs. Following World War II, the Unite States experienced a baby boom between 1946 and 1964 20 MINUTES!
Large species that live in more stable environments usually have slow life-history patterns. Reproduction Patterns:Slow life-history patterns • Reproduce and mature slowly, and are long-lived. • Maintain population sizes at or near carrying capacity. • Demographic data describes the characteristics of a population. For example, the U.S. Census collects demographic data such as age, gender, race, and income 22 MONTHS!
Organism Interactions • Population sizes are controlled by various interactions among organisms that share a community. • Predation and competition are two interactions that control populations. • The dependency ratio is the number of people between 14 and 64 years of age (working age) compared to the number of people aged 65 or older (retirement age) and under 14 years old (children) in a population. A high dependency ratio suggests that many people in the population are classified as dependent, under the age of 14 and over the age of 65
Crowding • These include aggression, decrease in parental care, decreased fertility, and decreased resistance to disease. • As populations increase in size in environments that cannot support increased numbers, individual animals can exhibit a variety of stress symptoms. • They become limiting factors for growth and keep populations below carrying capacity. • Since women have longer life expectancies than men, the majority of older persons in developed countries are women. Since women tend to outlive men, they are often single in older age while men tend to remarry. In developed countries, the older populations are growing at significantly faster rates than the younger population as a result of low birth and death rates. In 2000 and 2004 elections the 60-70 age group had higher voter turnout rates than any other age group
Deaths begin to exceed births and the population falls below carrying capacity S - Curve
Two types of limiting factors: Density-dependent and Density-independent Population density describes the number of individuals in a given area.
Population Density • Let’s say our classroom is 600 sq. ft. In 3rd hour and fifth hour, there are 25 students in the class. The population density for 3rd and 5fth hour is 25 students/600 ft² or .04 students/ft². In 6th hour, there are only 19 students in the class. Is the population density higher or lower?
Its flu season, and lots of sick students are coming to school. They are coughing, sneezing, and touching everything. Ten percent of Ms. Sonleitner’s students have the flu, but are so dedicated they come to class anyway. If Ms. Sonleitner wipes down every table before every class, which class will be most affected by the flu? 3rd and 5th hours, because they have the greatest population density. A larger number of students will be infected and have opportunity to infect a larger number of healthy students.
Six new students were added to sixth hour. The population densities of all the classes is now the same.The school is sponsoring an event that allows students to miss 3rd, 5th, and 6th hours. Which classes will be most effected? • All equally effected! The event will disrupt class regardless of size – everyone will have the opportunity to go.
Predation Populations of predators and their prey experience cycles or changes in their numbers over periods of time. Lynx and Hare pelts sold to the Hudson’s Bay Company
Competition • Is Density - Dependent • When only a few individuals compete for resources, no problem arises. • When a population increases to the point at which demand for resources exceeds the supply, the population size decreases.
1. What are the independent and dependent variables? 2. What is the population trend? 3. Why did this happen? Is this density-dependent or independent?
4. What type of growth is this? 5. When does growth increase? What might have happened to cause this?