Download
1 / 20
200 likes | 276 Views
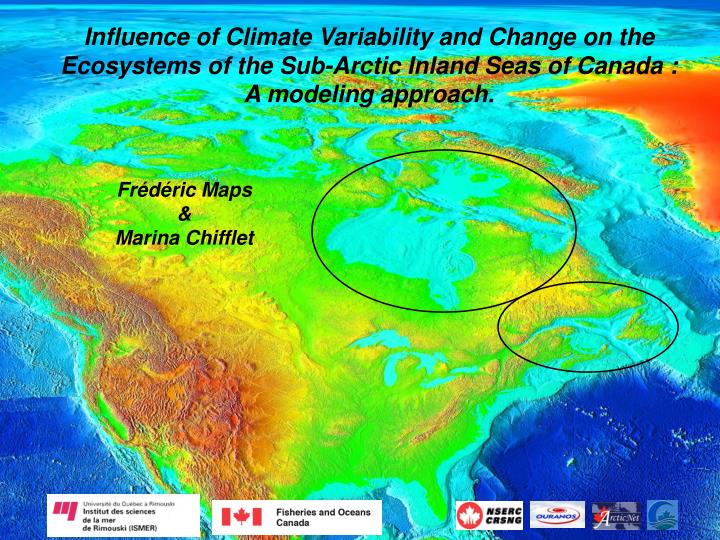
Influence of Climate Variability and Change on the Ecosystems of the Sub-Arctic Inland Seas of Canada : A modeling approach. Frédéric Maps & Marina Chifflet. Ongoing monitoring programs (visited weekly to yearly). Hudson Bay : MERICA visited yearly

E N D
Influence of Climate Variability and Change on the Ecosystems of the Sub-Arctic Inland Seas of Canada : A modeling approach. Frédéric Maps & Marina Chifflet
Ongoing monitoring programs (visited weekly to yearly) Hudson Bay: MERICA visited yearly moorings, T, S, dissolved oxygen, fluorescence, chlorophyll a, nutrients, zooplankton, benthos, fishes larvae Sea-ice observations (CIS) Gulf of St Lawrence: Atlantic Zone Monitoring Program fixed stations visited weekly to monthly, and sections visited twice in the year (spring and autumn) T, S, dissolved oxygen, fluorescence, chlorophyll a, nutrients, zooplankton abundance Thermographs Satellite Monitoring (ex. SeaWIFS)
coupled climate - sea-ice - ocean - ecosystem - biological models Coupler CRCM / GEM GCM GCM LW SW Atmosphere:temperature, winds, clouds, dewpoint, pressure, precipitation FAI, QAI, M AI Tides FAO, QAO, MAO snow Sea ice Ice algae Runoff Physical Ocean: FIO, QIO, M IO Water level, currents, temperature, salinity, turbulent energy and dissipation Primary production NPZD model Secondary production copepods population model Krill aggregation vertical behaviour model Harmful algae growth and vertical behaviour model (OBS or OGCM)
sea-ice – ocean circulation model Salinity Temperature Sea ice volume Observation Model Time (years) Prognostic hindcast solution for domain-averaged salinity & temperature profiles, and sea ice volume Saucier et al., in prep
sea-ice – ocean circulation model 0-30 m 30-100 m 100-200 m Comparison with annual temperature and salinity indices in depth ranges Salinity Temperature (oC) Depth range : 0-30 m 30-100 m 100-200 m MOD OBS Saucier et al., in prep
sea-ice – ocean circulation model Sea surface salinity Sea surface temperature (oC) Saucier et al., in prep
Domain-averaged salinity & temperature profiles, and sea ice cover & volume. Anomalies ( solution - standard run) sea-ice – ocean circulation model Sea ice cover concentration Current climate … + 2oC Simulation with air temperature + 2oC (stabilization experiment) Saucier et al., in prep
coupled ecosystem – sea-ice ocean circulation model Simulated nitrate and chlorophyll a1997 Le Fouest et al., 2005 Chifflet et al., in prep
coupled ecosystem – sea-ice ocean circulation model Comparisons to satellite-derived fields:chl a synoptic events Le Fouest et al., 2005
coupled ecosystem – sea-ice ocean circulation model Comparisons to satellite-derived fields:St. Lawrence discharge effect model satellite SST Chl a kCDOM vs Chl a AVHRR SeaWIFS SeaWIFS 3rd – 6th of August 1998 Le Fouest et al., submitted
coupled ecosystem – sea-ice ocean circulation model Interannual variability : ice cover vs chlorophyll a April 1997 April 1998 April 1999 Monthly mean ice cover % Monthly mean chl. a mg/m2 3 different ice cover for the 3 years 3 different patterns for the spring bloom Chifflet et al., in prep
coupled ecosystem – sea-ice ocean circulation model Interannual variability : chlorophyll a bloom 1997 1998 1999 Gulf bloom max : end April – end May bloom max : April maxbloom : April – end Mai Estuary bloom max : end May – end August bloom max : end May – Sept. bloom max : May – Sept. mgChla m-3 • ice concentration: determinant effect on the bloom timing • bloom in the estuary later than in the gulf • spring bloom in 1999: early and long, as it was observed • autumnal blooms in 1998 & 1999, but not in 1997, as it was observed on Seawifs images Chifflet et al., in prep
coupled ecosystem – sea-ice ocean circulation model 1997 1998 1999 Annual integrated production - gC/m2/an Mean winter nitrate concentration (mmolN m-2) Interannual variability in primary production Chifflet et al., in prep
coupled ecosystem – sea-ice ocean circulation model low freshwater runoff in Nov-Dec 98 & Jan-Feb 99: North Atlantic water entrance in the St. Lawrence estuary = rich in nutrients ? tides / storms during the winter ? Flow of nutrients at Québec city Temperature profile at Rimouski station Winter 1998/1999 no major differences of irradiance nutrients fluxes in the St. Lawrence estuary and the north-western region Chifflet et al., in prep
coupled ecosystem – sea-ice ocean circulation model Observed vs simulated nitrate concentration 1997 1998 1999 Spring Fall observed predicted Chifflet et al., in prep
coupled ecosystem – sea-ice ocean circulation model Observed vs simulated chlorophyll a biomass 1997 1998 1999 Spring Fall observed predicted Chifflet et al., in prep
101 100 10-1 10-2 101 100 10-1 10-2 Chla modèle (mgChla.m-3) Chla modèle (mgChla.m-3) 10-2 10-1 100 101 10-2 10-1 100 101 Chla observée (mgChla.m-3) Chla observée (mgChla.m-3) 101 100 10-1 10-2 101 100 10-1 10-2 Chla modèle (mgChla.m-3) Chla modèle (mgChla.m-3) 10-2 10-1 100 101 10-2 10-1 100 101 Chla observée (mgChla.m-3) Chla observée (mgChla.m-3) Spring RMS=0,69 mgChla.m-3 MRD= -421,7% Ratio=5,22 RMS=0,68 mgChla.m-3 MRD= -367,5 % Ratio=4,67 C/N et C/Chla constants C/N variable RMS=0,46 mgChla.m-3 MRD= -216,0 % Ratio=3,16 RMS=0,31 mgChla.m-3 MRD= -111,7% Ratio=2,11 C/N et C/Chla variables C/Chla variable
Autumn 101 100 10-1 10-2 101 100 10-1 10-2 RMS=0,49 mgChla.m-3 MRD= -95,49 % Ratio=1,96 RMS=0,43 mgChla.m-3 MRD= -11,12 % Ratio=1,11 Chla modèle (mgChla.m-3) Chla modèle (mgChla.m-3) C/N et C/Chla constants C/N variable 10-2 10-1 100 101 10-2 10-1 100 101 Chla observée (mgChla.m-3) Chla observée (mgChla.m-3) 101 100 10-1 10-2 101 100 10-1 10-2 RMS=0,45 mgChla.m-3 MRD= -74,29% Ratio=1,74 RMS=0,44 mgChla.m-3 MRD= -4,39% Ratio=0,95 Chla modèle (mgChla.m-3) Chla modèle (mgChla.m-3) C/N et C/Chla variables C/Chla variable 10-2 10-1 100 101 10-2 10-1 100 101 Chla observée (mgChla.m-3) Chla observée (mgChla.m-3)
In situ data used for initial and boundaries conditions Validation: in situ data and satellite images Conclusions • Detailed regional climate models can predict the synoptic to interannual variability of the general sea ice - ocean circulation • Fully coupled ecosystem model predict also the synoptic to interannual variability, especially primary production variability and nutrients concentration. Principal results: • high spatial and temporal variability: heterogeneous entity • ice cover: determinant effect on the spring bloom timing • pre-conditioning of the bloom during the winter? impact of synoptic events? role of the estuary and north-western region? Future steps • Improvement of the ecosystem model: St. Lawrence discharge of nutrient, C/chla, C/N, remineralization, carbon cycle, sulfur cycle… • Operational reanalyses of physical and biogeochemical fields for forcing / coupling to upper trophic levels • Climate change scenarios and seasonal forecasting
The team Principal investigators F. Saucier physical model B. Zakardjian coupled physical-ecosystem model Post-doc M. Chifflet NPZD model – Gulf of St. Lawrence Z.-P. Mei carbon cycle – Hudson Bay M. Sourrisseau krill model, harmful algae model – Gulf of St. Lawrence PhD M. Defossez physical model – Hudson Bay J. Fauchot harmful algae model – Gulf of St. Lawrence V. Le Fouest NPZD model – Gulf of St. Lawrence F. Maps copepods population model – Gulf of St. Lawrence V. Sibert sea-ice algae and NPZD models – Hudson Bay G. Smith physical model – Gulf of St. Lawrence Research assistants J. Caveen, F. Roy, S. Senneville Collaborators M. Gosselin, P. Larouche, D. Lavoie, D. Lefaivre S. Plourde, Y. Simard, M. Starr