Download
1 / 35
350 likes | 484 Views
Lessons learned from THORPEX THORPEX working group on Data Assimilation and Observing Strategies. Florence Rabier (Météo-France and CNRS, France, Co-chair) Pierre Gauthier (UQAM, Canada,Co-chair) Carla Cardinali (ECMWF, Int) Ron Gelaro (GMAO, USA) Ko Koizumi (JMA, Japan)

E N D
Lessons learned from THORPEX THORPEX working group on Data Assimilation and Observing Strategies Florence Rabier (Météo-France and CNRS, France, Co-chair) Pierre Gauthier (UQAM, Canada,Co-chair) Carla Cardinali (ECMWF, Int) Ron Gelaro (GMAO, USA) Ko Koizumi (JMA, Japan) Rolf Langland (NRL, USA) Andrew Lorenc (Met Office, UK) Peter Steinle (BMRC, Australia) Mickael Tsyrulnikov (HRCR, Russia) Nonlinear Processes in Geophysics, 15, 1-14, 2008 New WG being formed, including Observing Systems
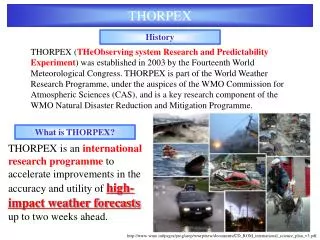
THORPEX and the DAOS-WG • “THORPEX: a Global Atmospheric Research Programme” established in 2003 by WMO. • Mission statement: “Accelerating improvements in the accuracy of high-impact 1-14 day weather forecasts for the benefit of society and the economy” • Design and demonstration of interactive forecast systems: enhancements to the observations usage in “sensitive regions” • Perform THORPEX Observing-System Tests and Regional field Campaigns to test and evaluate experimental remote-sensing and in-situ observing systems • DAOS-WG: evaluate and improve the impact of observations
Outline • Context • Main objectives • Assess impact of observations and observing system design • Targeting strategies • Improved use of observations • Illustrations from field campaigns (AMMA…), the Intercomparison experiment and the WMO Data Impact Workshop (http://www.wmo.int/pages/prog/www/OSY/Reports/NWP-4_Geneva2008_index.html)
Assessing the impact of observations • OSEs • OSSEs • DFS • Error variance reduction • Sensitivity to observations
Winter results: Baseline – Control (Z500)Impact of terrestrial, non-climate, observations NH ECMWF EUR Differences in RMS errors and significance bars for each forecast range
Control-Baseline (Z500)Normalised forecast error difference, Day-3 Geographical distribution of error reduction ECMWF
OSSE, conceptual model Nature run (output from high resolution, high quality climate model) Assessment End products Simulator Reference observations (RAOB, TOVS, GEO, surface, aircraft, etc.) Forecast products Analysis Forecast model Candidate observations (e.g. GEO MW) Initial conditions JCSDA
Tropical cyclone NR validation Preliminary findings suggest good degree of realism of Atlantic tropical cyclones in ECMWF NR. HL vortices: vertical structure Vertical structure of a HL vortex shows distinct eye-like feature and prominent warm core; low-level wind speeds exceed 55 m/s Reale O., J. Terry, M. Masutani, E. Andersson, L. P. Riishojgaard, J. C. Jusem (2007), Preliminary evaluation of the European Centre for Medium-Range Weather Forecasts' (ECMWF) Nature Run over the tropical Atlantic and African monsoon region, Geophys. Res. Lett., 34, L22810, doi:10.1029/2007GL031640.
DFS: Information content by area DFS= Tr(HK)=Tr(I-AB-1) M-F
Ensemble variational assimilationat Météo-France • Ensemble assimilation : simulation of the joint evolution of analysis, background and observation errors: • ea = (I – KH) eb + K eo. • Observations are explicited perturbed, while backgrounds are implicitly perturbed through cycling. (From Ehrendorfer, 2006)
Ensemble sb – sa with energy norm One month statistics (January 2007) at 00UTC 6 member 3D-Var FGAT ensemble Desroziers, M-F
Sensitivity to Observation (Langland and Baker, 2004) OBSERVATIONS ASSIMILATED 00UTC + 24h 14 Observations move the model state from the “background” trajectory to the new “analysis” trajectory The difference in forecast error norms, , is due to the combined impact of all observations assimilated at 00UTC
Taylor expansion of change in due to change in : Analysis equation allows transformation to observation-space: 3rd order approximation of in observation space: Estimating Observation Impact Forecast error measure (dry energy, sfc–140 hPa): …summed observation impact analysis adjoint model adjoint
The “weight” vector is computed only once, and involves the entire set of observations…removing or changing the properties of one observation changes the weight of all other observations. Valid forecast range limited by tangent linear assumption for Properties of the Impact Estimate The impact of arbitrary subsets of observations (e.g. instrument type, channel, location) can be easily quantified by summing only the terms involving the desired elements of . …the observation improves the forecast …the observation degrades the forecast …see Langland and Baker (2004), Errico (2007), Gelaro et al. (2007)
Forecast error norms and differences Global forecast error total energy norm (J kg-1) Forecasts from 0600 and 1800 UTC have larger errors e30 Forecast errors on background-trajectories e24 Forecast errors on analysis-trajectories e24– e30 (adjoint) e24– e30 (nonlinear) NRL
NAVDAS-NOGAPS Percent of observations that produce forecast error reduction (e24 – e30 < 0) NRL
AMMA RAOB Temperature Ob Impacts May-Oct 2006 BANAKO:61291 SUM= -0.5755 J kg-1 TAMANASET:60680 SUM= -0.2791 J kg-1 NRL
Example : AMV impact problem Date: Jan-Feb 2006 Issue: Non-beneficial impact from MTSAT AMVs at edge of coverage area ActionTaken: Data provider identified problem with wind processing algorithm. NRL
Comparison and Interpretation of ADJ and OSE Results …a few things to keep in mind… The ADJ measures the impacts of observations in the context of all other observations present in the assimilation system, while the OSE changes/degrades the system ( differs for each OSE member) The ADJ measures the impact of observations in each analysis cycle separately and against the control background, while the OSE measures the impact of removing information from both the background and analysis in a cumulative manner Comparison is restricted to the forecast range and metric for which the adjoint results are valid on the one hand (24h-energy in this study) and to the observing systems tested in the OSE on the other Gelaro
Combined Use of ADJ and OSEs (Gelaro et al., 2008) …ADJ applied to various OSE members to examine how the mix of observations influences their impacts Removal of AMSUA results in large increase in AIRS (and other) impacts Removal of AIRS results in significant increase in AMSUA impact Removal of raobs results in significant increase in AMSUA, aircraft and other impacts (but not AIRS) NASA, GMAO
Observation time Adjoint model or Ensemble Transform Evaluating and improving targeting strategies Verification time • Select additional observations or optimize the use of satellite sensors (sampling rate, thinning, chanel selection…) • Results depend on method, flow regimes • To be extended to Tropics (model error), evaluation at finer scales
The ATREC was led by EUCOS in the context of THORPEX. It involved UK Met office, ECMWF, Meteo-France, NRL, NASA, U of North Dakota, Meteorological Service of Canada, NCEP, FSL, NCAR and U of Miami A variety of observing platforms were deployed. AMDAR (550), ASAP ships (13), radiosondes (66), GOES rapid-scan winds and dropsondes. A-TReC (Atlantic THORPEX Regional Campaign) Oct15-Dec17 2003 Geopotential forecast error for the ATReC area (wrt analyses) Fourrié, et al, M-F
Impact of targeted obs • Targeting is possible and successful – mid-latitude targeted observations are about twice as effective as random observations. • Improvements to DA methods should improve the assimilation of all observations in sensitive regions, including targeted obs, but the statistical basis still means that only just over 50% will have a positive impact. • Improvements to targeting methods are possible (e.g. longer leads for large areas) but the statistical basis means that impacts on scores will vary. • Thanks to the general improvement of operational NWP, the average impact of individual observing systems is decreasing. • Targeting alone is unlikely to significantly accelerate improvements in the accuracy of 1 to 14-day weather forecasts compared to other improvements over the THORPEX period in NWP and satellites.
Improving the use of observations • Extending the use of satellite data • Bias correction
Improved representation of surface emissivity for the assimilation of microwave observations • Dynamical approach for the estimation of the emissivity from Satellite observations over land (Karbou 2006) • The estimation of emissivity has been adapted to Antarctica : snow and sea ice surfaces Karbou, M-F
Comparison of the new emissivity calculation with the old one, over sea ice New Old Fg-departure (K) (obs- first guess) histograms for AMSU-A, ch4 (July 2007) Fg-departure (K) (obs- first guess) histograms for AMSU-B, ch2 (July 2007)
Use of additional microwave data CONTROL Density of data Being actively assimilated EXP Bouchard, Karbou, M-F AMSUB- Ch3 AMSUA- Ch5
AMMA: The African Monsoon Multidisciplinary Analysis Better understand the mechanisms of the African monsoon and prevent dramatic situations (Redelsperger et al, 2006) Enhanced observations over West Africa in 2006 In particular, major effort to enhance the radiosonde network (Parker et al, 2008)
Impact of using the AMMA radiosonde dataset • New radiosonde stations • Enhanced time sampling • AMMA database: additional data which were not received in real time + enhanced vertical resolution • Bias correction for RH developed at ECMWF (Agusti-Panareda et al) • Data impact studies With various datasets, With and without RH bias correction Number of soundings provided on GTS in 2006 and 2005 Period: 15 July- 15 September, 0 and 12 UTC
Impact on quantitative prediction of precipitation over Africa CNTR: data from GTS AMMA: from the AMMA database AMMABC: AMMA + bias correction PreAMMA: with a 2005 network NOAMMA: No Radiosonde data Higher scores for AMMABC Faccani et al, M-F Lowest scores for NO AMMA
Work performed and lessons learnt • Impact of observations • Guidance for observation campaigns and the configuration of the Global Observing system • Assessment of the value of targeted observations (papers by Buizza, Cardinali, Kelly, in QJRMS) • Evaluation of observation impact with different systems (A-TReC, AMMA…). Need for relevant bias correction. • Intercomparison experiment for sensitivity to observations • Improving the use of satellite data • Extend our use of satellite data (density, cloudy/rainy, over land) • Important to study different methods and different systems to draw relevant conclusions