Download
1 / 6
60 likes | 88 Views
Sec 4.4 Scatter Plots and Lines of Best Fit. Scatter Plots. # of Books. Weight (lbs). Ex #1: Make a scatter plot for the following data: 3 6 3 8 4 6.5 4 9 6 7.5 6 12 7 9.5 7 11 8 12 8 13 . Line of best fit.

E N D
Scatter Plots # of Books Weight (lbs) Ex #1: Make a scatter plot for the following data: 3 6 3 8 4 6.5 4 9 6 7.5 6 12 7 9.5 7 11 8 12 8 13 Line of best fit
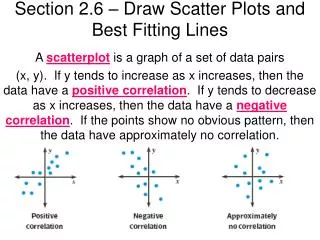
Types of Trends (or Correlation) Positive Trend – Upward trend • Goes up from left to right Negative Trend – Downward trend • Goes down from left to right No Trend – No trend can be determined Positive trend Negative Trend No Trend
Determine the trend, if any, for the following situations: • A) The number of leaves on a tree compared to the amount of sunlight beneath the tree • The age of a tree compared to the diameter of the tree’s trunk • The height of a tree compared to the age of the lumberjack cutting it down Downward (negative) trend Upward (positive) trend No trend
Writing the equation of a line of best fit: Graph the set of data, draw a line of best fit and write an equation for it: • x y • • • 5 1 2 (6, 4) • • • 4 3 3 (2, 3) • 3 3.75 3 4 4 2 5 3.25 1 6 4.5 1 2 3 4 5 6
The following is a scatter plot showing the amount of hotdogs Joey the Hut ate during the first five minutes of his last several contests. Write the equation to the line of best. Use the equation to predict the number of hotdogs that Joey could eat in a 10 minute contest. 10 • • • 8 (5, 9) • • • • 6 • • • # of hotdogs eaten • (2, 4) 4 • • • • 2 • 1 2 3 4 5 6 Time(min) Joey should be able to eat 17⅓ hotdogs in 10 minutes