Download
1 / 73
750 likes | 876 Views
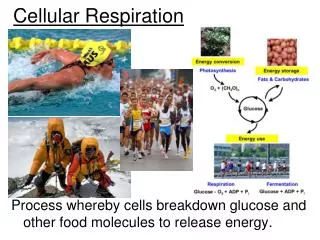
Cellular Respiration. A.P. Biology. Light energy. ECOSYSTEM. Photosynthesis in chloroplasts. Organic molecules. CO 2 + H 2 O. + O 2. Cellular respiration in mitochondria. ATP. powers most cellular work . Heat energy. Figure 9.2. Energy.

E N D
Cellular Respiration A.P. Biology
Light energy ECOSYSTEM Photosynthesisin chloroplasts Organicmolecules CO2 + H2O + O2 Cellular respirationin mitochondria ATP powers most cellular work Heatenergy Figure 9.2 Energy • Flows into an ecosystem as sunlight and leaves as heat
Catabolic pathways yield energy by oxidizing organic fuels • The breakdown of organic molecules is exergonic • Fermentation • Is a partial degradation of sugars that occurs without oxygen
Catabolic pathways yield energy by oxidizing organic fuels • Cellular respiration • Is the most prevalent and efficient catabolic pathway • Consumes oxygen and organic molecules such as glucose • Yields ATP
Redox Reactions: Oxidation and Reduction • Catabolic pathways yield energy • Due to the transfer of electrons • Redox reactions • Transfer electrons from one reactant to another by oxidation and reduction • Oxidation • A substance loses electrons, or is oxidized • Reduction • A substance gains electrons, or is reduced
becomes oxidized(loses electron) becomes reduced(gains electron)
Products Reactants becomes oxidized + + + Energy 2O2 CO2 2 H2O CH4 becomes reduced H C C O O O O H O H H H H Oxygen(oxidizingagent) Methane(reducingagent) Carbon dioxide Water Figure 9.3 Some redox reactions • Do not completely exchange electrons • Change the degree of electron sharing in covalent bonds
becomes oxidized C6H12O6 + 6O2 6CO2 + 6H2O + Energy becomes reduced Oxidation of Organic Fuel Molecules During Cellular Respiration • During cellular respiration • Glucose is oxidized and oxygen is reduced G = -686 kcal/mol
H2 + 1/2 O2 Explosiverelease ofheat and lightenergy (a) Uncontrolled reaction Free energy, G Figure 9.5 A H2O Step by step catabolism of glucose • If electron transfer is not stepwise • A large release of energy occurs • As in the reaction of hydrogen and oxygen to form water
2 H + 1/2 O2 (from food via NADH) Controlled release of energy for synthesis ofATP 2 H+ + 2 e– ATP ATP Free energy, G Electron transport chain ATP 2 e– 1/2 O2 2 H+ H2O Figure 9.5 B (b) Cellular respiration ETC • The electron transport chain • Passes electrons in a series of steps • Uses the energy from the electron transfer to form ATP
2 e– + 2 H+ 2 e– + H+ NAD+ NADH H Dehydrogenase O O H H Reduction of NAD+ + + 2[H] C NH2 NH2 C (from food) Oxidation of NADH N N+ Nicotinamide(reduced form) Nicotinamide(oxidized form) CH2 O O O O– P O H H OH O O– HO P NH2 HO CH2 O N N H N H N O H H HO OH Figure 9.4 NAD – Nicotinamide Adenine Dinucleotide(Electron Acceptor) • Electrons from organic compounds • Are usually 1st transferred to NAD+, a coenzyme Dehydragenase – removes 2 hydrogen atoms
NADH • NADH, the reduced form of NAD+ • Passes the electrons to the electron transport chain • Electrons are ultimately passed to a molecule of oxygen (Final electron acceptor) G = -53 kcal/mol Electron path in respiration Food NADH ETC Oxygen
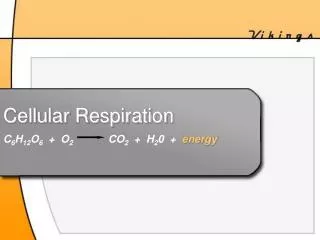
Cellular Respiration • Respiration is a cumulative function of three metabolic stages • Glycolysis • The citric acid cycle (TCA or Krebbs) • Oxidative phosphorylation C6H12O6+ 6O2 <----> 6 CO2+ 6 H20 + e- ---> 36-38 ATPDG = -686 Kc/mole 263Kc = 38%
Respiration • Glycolysis • Breaks down glucose into two molecules of pyruvate • The citric acid cycle • Completes the breakdown of glucose • Oxidative phosphorylation • Is driven by the electron transport chain • Generates ATP
Electrons carried via NADH and FADH2 Electrons carried via NADH Oxidativephosphorylation:electron transport andchemiosmosis Citric acid cycle Glycolsis Pyruvate Glucose Cytosol Mitochondrion ATP ATP ATP Substrate-level phosphorylation Oxidative phosphorylation Substrate-level phosphorylation Figure 9.6 Respiration Overview 2 ATP 2 ATP 34 ATP
Enzyme Enzyme ADP P Substrate + ATP Product Figure 9.7 Substrate Level Phosphorylation • Both glycolysis and the citric acid cycle • Can generate ATP by substrate-level phosphorylation
Oxidativephosphorylation Glycolysis Citricacidcycle ATP ATP ATP Energy investment phase Glucose 2 ATP + 2 used 2 ATP P Energy payoff phase formed 4 ATP 4 ADP + 4 P 2 NADH 2 NAD+ + 4 e- + 4 H + + 2 H+ 2 Pyruvate + 2 H2O Glucose 2 Pyruvate + 2 H2O 4 ATP formed – 2 ATP used 2 ATP + 2 H+ 2 NAD+ + 4 e– + 4 H + 2 NADH Figure 9.8 Glycolysis • Harvests energy by oxidizing glucose to pyruvate • Glycolysis • Means “splitting of sugar” • Breaks down glucose into pyruvate • Occurs in the cytoplasm of the cell • Two major phases • Energy investment phase • Energy payoff phase
The First Stage of Glycolysis • Glucose (6C) is broken down into 2 PGAL's (3C) • This requires two ATP's
The Second Stage of Glycolysis • 2 PGAL's (3C) are converted to 2 pyruvates • This creates 4 ATP's and 2 NADH's • The net ATP production of Glycolysis is 2 ATP's
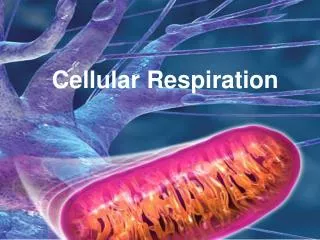
Citric Acid Cyclea.k.a. Krebs Cycle • Completes the energy-yielding oxidation of organic molecules • The citric acid cycle • Takes place in the matrix of the mitochondrion
Krebs's Cycle (citric acid cycle, TCA cycle) • Goal: take pyruvate and put it into the Krebs's cycle, producing NADH and FADH2 • Where: the mitochondria • There are two steps • The Conversion of Pyruvate to Acetyl CoA • The Kreb's Cycle proper • In the Krebs's cycle, all of Carbons, Hydrogens, and Oxygeng in pyruvate end up as CO2 and H2O • The Krebs's cycle produces 2 ATP's, 8 NADH's, and 2FADH2's per glucose molecule
CYTOSOL MITOCHONDRION + H+ NAD+ NADH O– CoA S 2 C O C O C O CH3 1 3 CH3 Acetyle CoA Pyruvate CO2 Coenzyme A Transport protein Figure 9.10 Before the citric acid cycle can begin • Pyruvate must first be converted to acetyl CoA, which links the cycle to glycolysis
Pyruvate(from glycolysis,2 molecules per glucose) Oxidativephosphorylation Glycolysis Citricacidcycle ATP ATP ATP CO2 CoA NADH + 3 H+ Acetyle CoA CoA CoA Citricacidcycle 2 CO2 3 NAD+ FADH2 FAD 3 NADH + 3 H+ ADP + Pi ATP Figure 9.11 An overview of the citric acid cycle
Citric acid cycle Oxidative phosphorylation Glycolysis S CoA C O CH3 Acetyl CoA CoA SH H2O O C COO– NADH 1 COO– CH2 + H+ COO– CH2 COO– NAD+ Oxaloacetate 8 C COO– HO CH2 2 CH2 HC COO– COO– COO– HO CH HO CH Malate Citrate COO– CH2 Isocitrate COO– CO2 Citric acid cycle 3 H2O 7 NAD+ COO– NADH COO– CH + H+ Fumarate CH2 CoA SH HC a-Ketoglutarate CH2 COO– C O 4 6 SH CoA COO– COO– COO– CH2 5 CH2 FADH2 CO2 CH2 CH2 NAD+ FAD C O COO– Succinate NADH CoA S P i + H+ Succinyl CoA GDP GTP ADP ATP Figure 9.12
The Kreb's Cycle • 6 NADH's are generated • 2 FADH2 is generated • 2 ATP are generated • 4 CO2's are released
Net Engergy Production from Aerobic Respiration • Glycolysis: 2 ATP • Kreb's Cycle: 2 ATP • Electron Transport Phosphorylation: 32 ATP • Each NADH produced in Glycolysis is worth 2 ATP (2 x 2 = 4) - the NADH is worth 3 ATP, but it costs an ATP to transport the NADH into the mitochondria, so there is a net gain of 2 ATP for each NADH produced in gylcolysis • Each NADH produced in the conversion of pyruvate to acetyl COA and Kreb's Cycle is worth 3 ATP (8 x 3 = 24) • Each FADH2 is worth 2 ATP (2 x 2 = 4) • 4 + 24 + 4 = 32 • Net Energy Production: 36 ATP
Energy Yields: • Glucose: 686 kcal/mol • ATP: 7.5 kcal/mol • 7.5 x 36 = 270 kcal/mol for all ATP's produced • 270 / 686 = 39% energy recovered from aerobic respiration
After the Krebs Cycle… • During oxidative phosphorylation, chemiosmosis couples electron transport to ATP synthesis • NADH and FADH2 • Donate electrons to the electron transport chain, which powers ATP synthesis via oxidative phosphorylation
The Pathway of Electron Transport • In the electron transport chain • Electrons from NADH and FADH2 lose energy in several steps • At the end of the chain • Electrons are passed to oxygen, forming water
NADH 50 FADH2 Multiproteincomplexes I 40 FAD FMN II Fe•S Fe•S O III Cyt b Fe•S 30 Cyt c1 IV Cyt c Free energy (G) relative to O2 (kcl/mol) Cyt a Cyt a3 20 10 O2 0 2 H + + 12 Figure 9.13 H2O
INTERMEMBRANE SPACE A rotor within the membrane spins clockwise whenH+ flows past it down the H+ gradient. H+ H+ H+ H+ H+ H+ H+ A stator anchoredin the membraneholds the knobstationary. A rod (for “stalk”)extending into the knob alsospins, activatingcatalytic sites inthe knob. H+ Three catalytic sites in the stationary knobjoin inorganic Phosphate to ADPto make ATP. ADP + ATP P i MITOCHONDRIAL MATRIX Figure 9.14 Chemiosmosis: The Energy-Coupling Mechanism • ATP synthase • Is the enzyme that actually makes ATP
ETC • Electron transfer causes protein complexes to pump H+ from the mitochondrial matrix to the intermembrane space • The resulting H+ gradient • Stores energy • Drives chemiosmosis in ATP synthase • Is referred to as a proton-motive force
Chemiosmosis • Is an energy-coupling mechanism that uses energy in the form of a H+ gradient across a membrane to drive cellular work H+ gradient = Proton motive force
Inner Mitochondrial membrane Oxidative phosphorylation. electron transport and chemiosmosis Glycolysis ATP ATP ATP H+ H+ H+ H+ Cyt c Protein complex of electron carners Intermembrane space Q IV I III ATP synthase Inner mitochondrial membrane II H2O FADH2 2 H+ + 1/2 O2 FAD+ NADH+ NAD+ ATP ADP + P i (Carrying electrons from, food) H+ Mitochondrial matrix Chemiosmosis ATP synthesis powered by the flow Of H+ back across the membrane Electron transport chain Electron transport and pumping of protons (H+), which create an H+ gradient across the membrane Figure 9.15 Oxidative phosphorylation
An Accounting of ATP Production by Cellular Respiration • During respiration, most energy flows in this sequence • Glucose to NADH to electron transport chain to proton-motive force to ATP
Electron shuttles span membrane MITOCHONDRION CYTOSOL 2 NADH or 2 FADH2 2 FADH2 2 NADH 2 NADH 6 NADH Glycolysis Oxidative phosphorylation: electron transport and chemiosmosis Citric acid cycle 2 Acetyl CoA 2 Pyruvate Glucose + 2 ATP + 2 ATP + about 32 or 34 ATP by substrate-level phosphorylation by substrate-level phosphorylation by oxidative phosphorylation, depending on which shuttle transports electrons from NADH in cytosol About 36 or 38 ATP Maximum per glucose: Figure 9.16