Download
1 / 14
180 likes | 449 Views
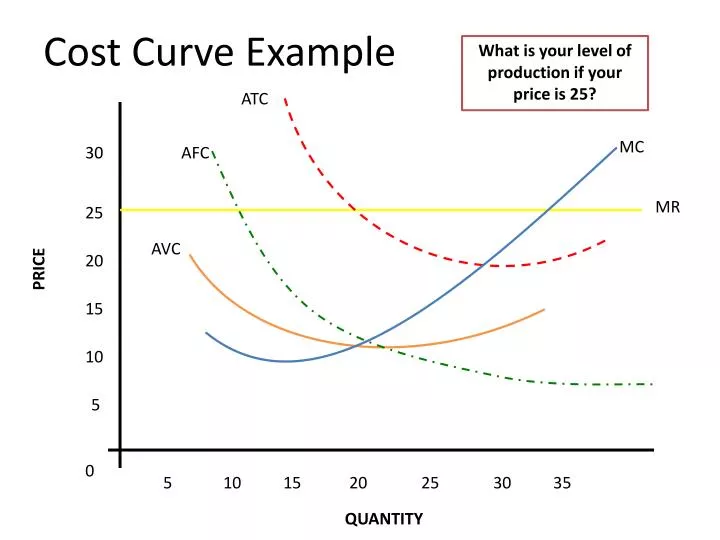
Cost Curve Example. What is your level of production if your price is 25?. ATC. 30. MC. AFC. 25. 20. AVC. 15. 10. 5. 0. 5. 10. 15. 20. 25. 30. 35. MR. PRICE. QUANTITY. Cost Curve Example. What is your level of production if your price is 25?. ATC. 30. MC. AFC. 25. 20.

E N D
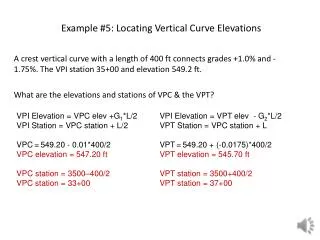
Cost Curve Example What is your level of production if your price is 25? ATC 30 MC AFC 25 20 AVC 15 10 5 0 5 10 15 20 25 30 35 MR PRICE QUANTITY
Cost Curve Example What is your level of production if your price is 25? ATC 30 MC AFC 25 20 AVC 15 10 5 0 5 10 15 20 25 30 35 REMEMBER: Profit Max occurs where MC=MR=P MR PRICE QUANTITY
What is TR? ATC 30 MC AFC 25 20 AVC 15 10 5 MR PRICE 0 5 10 15 20 25 30 35 QUANTITY
TR= Grey Area ATC 30 MC AFC 25 20 AVC 15 10 5 Grey Area: TR= Price * Q MR PRICE 0 5 10 15 20 25 30 35 QUANTITY
What is TC? ATC 30 MC AFC 25 20 AVC 15 10 5 MR PRICE 0 5 10 15 20 25 30 35 QUANTITY
TC = Red Area ATC 30 MC AFC 25 20 AVC 15 10 5 Red area: TC = ATC x Q MR PRICE 0 5 10 15 20 25 30 35 QUANTITY
What area shows Economic Profits? ATC 30 MC AFC 25 20 AVC 15 10 5 MR PRICE 0 5 10 15 20 25 30 35 QUANTITY
Economic Profits = Green Area ATC 30 MC AFC 25 20 AVC 15 10 5 Green Area Economic Profits = TR - TC MR PRICE 0 5 10 15 20 25 30 35 QUANTITY
What is the Breakeven Price and Quantity? ATC 30 MC AFC 25 20 AVC 15 10 5 MR PRICE 0 5 10 15 20 25 30 35 QUANTITY
Breakeven Price and Quantity = Pink Lines ATC 30 MC AFC 25 20 AVC 15 10 5 It’s the price that just covers total costs TR = TC implies economic profits are zero Minimum ATC MR PRICE 0 5 10 15 20 25 30 35 QUANTITY
What is the Shutdown Price and Quantity? ATC 30 MC AFC 25 20 AVC 15 10 5 MR PRICE 0 5 10 15 20 25 30 35 QUANTITY
Shutdown Price and Quantity = Turquoise Lines ATC 30 MC AFC 25 20 AVC 15 10 5 It’s the price that just covers total variable costs Minimum AVC MR PRICE 0 5 10 15 20 25 30 35 QUANTITY
What is the Supply Curve? ATC 30 MC AFC 25 20 AVC 15 10 5 MR PRICE 0 5 10 15 20 25 30 35 QUANTITY
Supply Curve = Lime Green Line ATC 30 MC AFC 25 20 AVC 15 10 5 MC curve above the AVC MR PRICE 0 5 10 15 20 25 30 35 QUANTITY