Download
1 / 1
10 likes | 116 Views
Abatement cost curve for the forestry sector 2030. Forestation. Avoided deforestation. Additional potential at 40–80 EUR/tCO 2. EUR/tCO 2 e. Africa. OECD. Asia. Americas. Asia. 65. Americas. Africa. 60. 55. 50. 45. Asia. 40. Americas. 35. 30. 25. OECD. Africa. Americas.

E N D
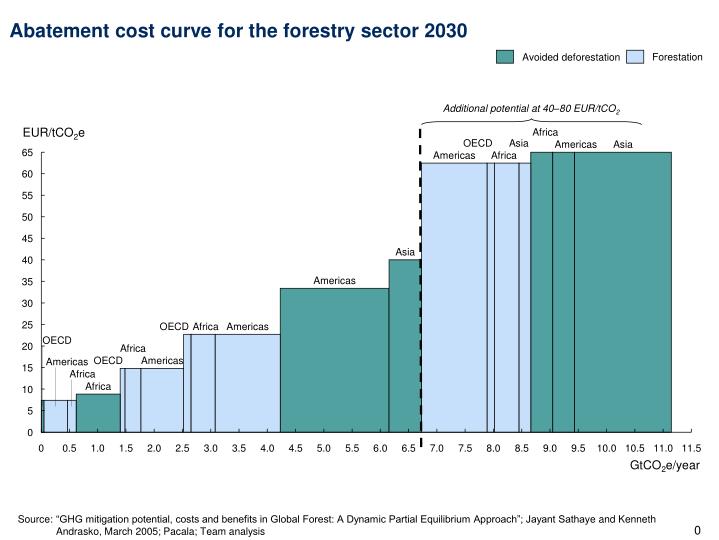
Abatement cost curve for the forestry sector 2030 • Forestation • Avoided deforestation • Additional potential at 40–80 EUR/tCO2 EUR/tCO2e • Africa • OECD • Asia • Americas • Asia • 65 • Americas • Africa • 60 • 55 • 50 • 45 • Asia • 40 • Americas • 35 • 30 • 25 • OECD • Africa • Americas • OECD • 20 • Africa • OECD • Americas • Americas • 15 • Africa • Africa • 10 • 5 • 0 • 0 • 0.5 • 1.0 • 1.5 • 2.0 • 2.5 • 3.0 • 3.5 • 4.0 • 4.5 • 5.0 • 5.5 • 6.0 • 6.5 • 7.0 • 7.5 • 8.0 • 8.5 • 9.0 • 9.5 • 10.0 • 10.5 • 11.0 • 11.5 • GtCO2e/year Source: “GHG mitigation potential, costs and benefits in Global Forest: A Dynamic Partial Equilibrium Approach”; Jayant Sathaye and Kenneth Andrasko, March 2005; Pacala; Team analysis