Download
1 / 7
70 likes | 174 Views
Marginal Abatement Cost (MAC) Curve Example of Poland. Leszek Kasek World Bank, Europe and Central Asia Region Skopje, March 1, 2011 Prospects for Green Growth in Macedonia. Methodological approach. Issues. Theoretical concept How to read the cost curve diagram?

E N D
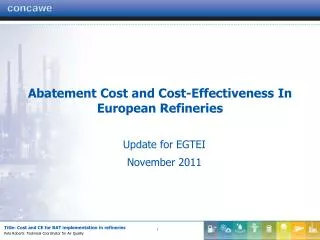
Marginal Abatement Cost (MAC) CurveExample of Poland LeszekKasek World Bank, Europe and Central Asia Region Skopje, March 1, 2011 Prospects for Green Growth in Macedonia. Methodological approach
Issues • Theoretical concept • How to read the cost curve diagram? • MicroMAC curve for Poland 2030 • Abatement potential by groups of interventions • Capital expenses and operational cost savings, 2010-2030 • DATA requirements
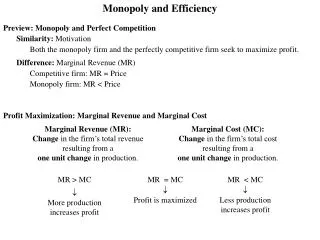
Theoretical concept - Reduce GHG emissions as long as Marginal Costs of GHG abatement MAC exceed Marginal Social Costs (MSC) E emissions $/ton cost per 1 ton CO2 emissions MAC marginal abatement cost MSC marginal social cost (damages caused by E) T cap MC(T) carbon tax Source: Based on: Jacoby and Ellerman, 2002.
MicroMAC curve for Poland 2030 Source: McKinsey and Co.
Abatement potential by groups of interventions Source: McKinsey and Co.
Capital expenses and operational cost savings, 2010-2030 Source: McKinsey and Co.