Download
1 / 43
430 likes | 614 Views
Association mapping with high density marker panels. Jeffrey Barrett. Outline. Linkage disequilibrium and recombination HapMap ‘Tag’ SNPs Basic association Practical. Linkage disequilibrium. Linkage disequilibrium. time. Indirect association. Measuring LD. locus 1. D = 11 - pq.

E N D
Association mapping with high density marker panels Jeffrey Barrett
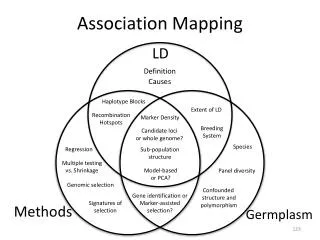
Outline • Linkage disequilibrium and recombination • HapMap • ‘Tag’ SNPs • Basic association • Practical
Measuring LD locus 1 D = 11 - pq locus 2 D´ = D/DMAX r2 = D2/p(1-p)q(1-q)
Theoretical and empirical LD Reich et al. Nature (2001)
Genotypes vs haplotypes Genotypes: AA CT CC GA Haplotypes: ACCG / ATCA ACCA / ATCG ATCG / ACCA ATCA / ACCG 2n possible reconstructions n = number of heterozygous sites
Limited haplotype diversity Daly et al, Nat Genet (2001)
HapMap samples 90 Yoruba individuals (30 parent-parent-offspring trios) from Ibadan, Nigeria (YRI) 90 individuals (30 trios) of European descent from Utah (CEU) 45 Han Chinese individuals from Beijing (CHB) 45 Japanese individuals from Tokyo (JPT)
HapMap SNPs PHASE I: 1,000,000 successful SNPs across the genome PHASE II: 5,000,000 additional SNPs attempted ~4,000,000 total polymorphic SNPs genomewide Panel %r2 > 0.8 max r2 YRI 81 0.90 CEU 94 0.97 CHB+JPT 94 0.97
Enabling association studies:dbSNP International HapMap Project. Nature (2005).
Tagging Reference panel: HapMap data Tags: SNPs chosen for genotyping with the aim of capturing as much information as possible Tests: statistical tests for association to disease
Pairwise tagging G/C 3 G/A 2 T/C 4 G/C 5 A/T 1 A/C 6 G G G G A A G T T G G A C C C C C C C C C C C C A A A A T T G G G C C C high r2 high r2 high r2 Tags: SNP 1 SNP 3 SNP 6 3 in total Test for association: SNP 1 SNP 3 SNP 6 Carlson et al. (2004) AJHG 74:106
Testing tags for association Genotype tags in cases and controls Each tag is tested for association How can we better use this information?
Use of haplotypes can improve genotyping efficiency G/C 3 G/A 2 T/C 4 G/C 5 A/T 1 A/C 6 G G G G A A G T T G G A A C C C C C C C C C C C C C C C A A A A T T G G G C C C Tags: SNP 1 SNP 3 2 in total Test for association: SNP 1 captures 1+2 SNP 3 captures 3+5 “AG” haplotype captures SNP 4+6 Tags: SNP 1 SNP 3 SNP 6 3 in total Test for association: SNP 1 SNP 3 SNP 6 de Bakker et al. (2005) Nat Genet 37:1217
Efficiency de Bakker et al. (2005) Nat Genet 37:1217
Transferability among populations CEU CEU CEU Utah residents with European ancestry(CEPH) Whites from Los Angeles, CA Botnia, Finland PIW de Bakker et al.
Genome-wide tagging coverage Barrett and Cardon, Nat Genet (2006).
Population structure Marchini, Nat Genet (2004)
Population structure - Genomic control- genome-wide inflation of median test statistic
Crohn’s collection center Center 3: = 1.77 All others: = 1.09
IBS clustering Compute IBS between all pairs of individuals, as well as 270 HapMap samples Create a distance matrix of (1-IBS) Classical multidimensional scaling generates principal components which capture largest fraction of variation
Plate effects Transition to SSF site
Association: allelic 2 • Assumes: • multiplicative • HW equilibrium
Haploview practical • www.hapmap.org • Find bounding hotspots for CARD15 (>10 cM/Mb) • Download file for this window
Haploview practical • What fraction of the dataset can be captured with 8 pairwise tags? • How much more information can be gained by using multimarker tagging?
Haploview practical Data in F:\barrett Is our result experiment-wide significant?