Download
1 / 22
230 likes | 373 Views
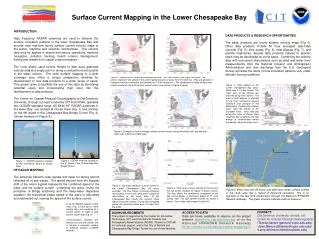
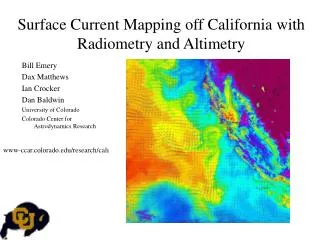
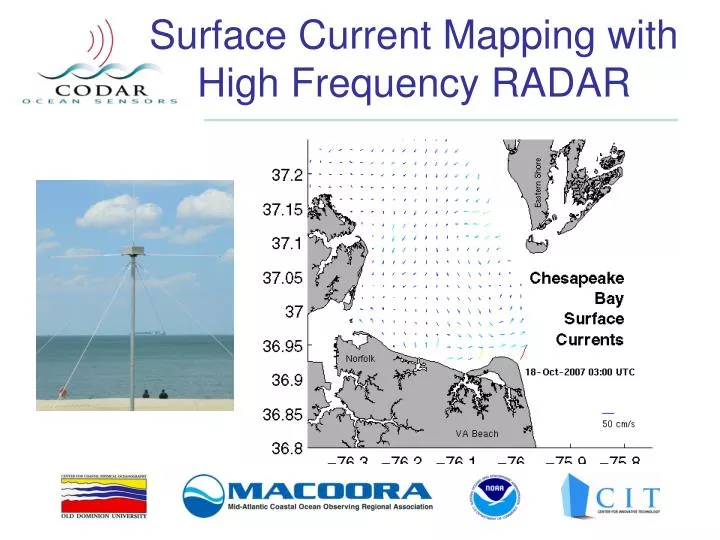
Surface Current Mapping with High Frequency RADAR. Applications. Search and rescue Navigation Pollution Tracking (Oil spills, red tides, …) Recreational boating Fishing Assimilation into numerical circulation models to improve nowcast/forecast capabilities. Study Area & Antenna Sites.

E N D
Applications • Search and rescue • Navigation • Pollution Tracking (Oil spills, red tides, …) • Recreational boating • Fishing • Assimilation into numerical circulation models to improve nowcast/forecast capabilities
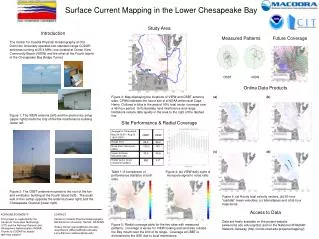
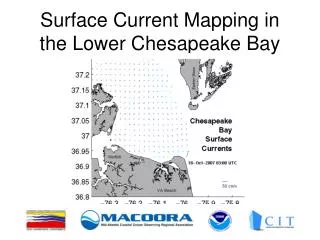
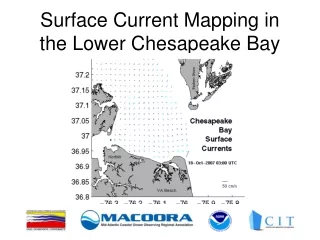
Study Area & Antenna Sites Source: http://www.cbbt.com/ Source: U.S. Geological Survey (www.seamless.usgs.gov/viewer)
Chesapeake Bay Bridge Tunnel (CBBT) AT OUR FIELD SITES 25.4 MHz CODAR Standard Range Antennas with co-located Tx/Rx MiniMac Field Computers Cell phone/Cable modem connections Ocean View Community Beach (VIEW)
Operating Costs • Equipment (antenna, computer, electronics enclosure, software) roughly 150K / site • Power / network connections / access to the site • CBBT $220/ month • VIEW $100/ month • Technician • Additional costs: Pattern measurements
Data Products Updated Hourly (http://www.lions.odu.edu/org/cbc) Hourly Velocity Trajectories Sub-tidal Flow Time Series
HF RADAR National Network UCSD, Scripps Institute http://cordc.ucsd.edu/projects/mapping/maps
f = 25MHz λ=12m Antenna Water speed is determined using the frequency shift, fs, in the return signal. fobs=25 + fs f=25 ½ λ Ocean waves with strongest return signal
Radial Current Velocities… are combined on a grid A single antenna measures only one component of the water velocity, the speed of the water moving directly towards or away from it. Radial vectors are output in range bins of 1.5 km and directional bins of 5 degrees. The grid is designed by the operator. Mapping requires at least two antennas!
Grid for Total Current Vectors 2 km Grid courtesy of CORDC National Network Preserves orthogonality Red points fail stability angle requirements Baseline
2.5 km Gridpoint Radial Current Velocities Around each grid point… Combine Radial Vectors (Least Squares Average) + Grid Total Current Velocities
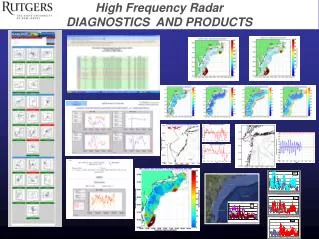
Data Quality Calibration and Radial Coverage
Radial Coverage Antenna Patterns CBBT VIEW
Challenges • At a 360° site, antenna pattern measurement is essential • Antenna isolation • Summertime heat • Interference (Natural & Man-made)
Data Validation by Comparison • Baseline (consistency) • Tide • Moored ADCP • Towed ADCP Photo Source: NOAA OSTEP report
Baseline Comparisons Ideal antenna patterns Measured antenna patterns
Moored ADCP Comparison Difference Statistics Red line = CODAR Blue line = NOAA ADCP Black = |NOAA-CODAR| SiteMeanS.Dev Cape Henry 16.2 14.0 Thimble Shoals 13.2 11.2 York Spit 13.9 10.0 (CH) (TS) (YS)
CODAR Current Research & Development • Bistatic system: enhance coverage by using precise timing so that Rx can receive sea scatter from another transmitter (e.g. on a buoy) • RiverSonde • Ship detection • Shallow water waves Source: CODAR Research & Development poster
Our Future Plans • Incorporate data into GIS; map with other regional spatial data • Continue to work with trajectories/ plume tracking • Model comparisons • Outreach (VA Aquarium, education) • Web page & product development • Shipping channels • Ocean View beaches AVHRR SST Daily Composite, September 24, 2007 from NOAA Coastwatch ChesROMS model output
Acknowledgements • Larry Atkinson and Jose Blanco • CIT, MACOORA, NOAA • CODAR support • Advice and assistance from numerous other HF RADAR operators