Download
1 / 65
650 likes | 870 Views
Association Mapping. Benjamin Neale 19 th International Workshop on Twin Methodology 2006. Liberally sampled from talks by Lon Cardon and Shaun Purcell. Outline. Association and linkage Association and linkage disequilibrium History and track record of association studies Challenges

E N D
Association Mapping Benjamin Neale 19th International Workshop on Twin Methodology 2006 Liberally sampled from talks by Lon Cardon and Shaun Purcell
Outline • Association and linkage • Association and linkage disequilibrium • History and track record of association studies • Challenges • Example
Outline • Association and linkage • Association and linkage disequilibrium • History and track record • Challenges • Example
Association Studies Simplest design possible Correlate phenotype with genotype Candidate genes for specific diseases common practice in medicine/genetics Pharmacogenetics genotyping clinically relevant samples (toxicity vs efficacy) Positional cloning recent popular design for human complex traits Genome-wide association with millions available SNPs, can search whole genome exhaustively
SNPs/ markers trait variant chromosome haplotypes genotypes alleles Definitions Population Data Correlate any of these with phenotype (continuous trait or affection status)
Allelic Association SNPs trait variant chromosome B/b Genetic variation yields phenotypic variation More copies of ‘B’ allele More copies of ‘b’ allele
2a Genotype Genetic Value BB Bb bb a d -a Biometrical Model d bb midpoint Bb BB Va (QTL) = 2pqa2 (no dominance)
Simplest Regression Model of Association Yi = a + bXi + ei where Yi = trait value for individual i Xi = 1 if allele individual i has allele ‘A’ 0 otherwise i.e., test of mean differences between ‘A’ and ‘not-A’ individuals 0 1
Association Study Designs and Statistical Methods • Designs • Family-based • Trio (TDT), sib-pairs/extended families (QTDT) • Case-control • Collections of individuals with disease, matched with sample w/o disease • Some ‘case only’ designs • Statistical Methods • Wide range: from t-test to evolutionary model-based MCMC • Principle always same: correlate phenotypic and genotypic variability
Biometrical basis Variance model (linkage) pijk = proportion of alleles shared ibd at marker s2a = additive genetic variance parameter s2g = polygenic (residual) variance parameter s2e = environmental (residual) variance parameter Linear model (association) Likelihood Linear Model of Association (Fulker et al, AJHG, 1999) gij: background genetic eij: background environment
3/5 2/6 Allele coded by CA copies 2 = CACA 6 = CACACACACACA 3/2 5/2 4/3 Disease linked to ‘5’ allele in dominant inheritance 3/5 3/2 4/5 Linkage: Allelic association WITHIN FAMILIES affected unaffected unaffected
Allelic Association: Extension of linkage to the population 3/5 2/6 3/5 2/6 3/6 3/2 5/6 5/2 Both families are ‘linked’ with the marker, but a different allele is involved
3/5 2/6 3/6 5/6 Allelic Association Extension of linkage to the population 3/6 2/4 4/6 2/6 3/2 6/2 6/6 6/6 All families are ‘linked’ with the marker Allele 6 is ‘associated’ with disease
Allelic Association Controls Cases 6/6 6/2 3/5 3/4 3/6 5/6 2/4 3/2 3/6 6/6 4/6 2/6 2/6 5/2 Allele 6 is ‘associated’ with disease
Power of Linkage vs Association • Association generally has greater power than linkage • Linkage based on variances/covariances • Association based on means
Localization • Linkage analysis yields broad chromosome regions harbouring many genes • Resolution comes from recombination events (meioses) in families assessed • ‘Good’ in terms of needing few markers, ‘poor’ in terms of finding specific variants involved • Association analysis yields fine-scale resolution of genetic variants • Resolution comes from ancestral recombination events • ‘Good’ in terms of finding specific variants, ‘poor’ in terms of needing many markers
Linkage Family-based Matching/ethnicity generally unimportant Few markers for genome coverage (300-400 STRs) Can be weak design Good for initial detection; poor for fine-mapping Powerful for rare variants Association Families or unrelateds Matching/ethnicity crucial Many markers req for genome coverage (105 – 106 SNPs) Powerful design Poor for initial detection; good for fine-mapping Powerful for common variants; rare variants generally impossible Linkage vs Association
Outline • Association and linkage • Association and linkage disequilibrium • History and track record • Challenges • Example
Allelic Association Three Common Forms • Direct Association • Mutant or ‘susceptible’ polymorphism • Allele of interest is itself involved in phenotype • Indirect Association • Allele itself is not involved, but a nearby correlated • marker changes phenotype • Spurious association • Apparent association not related to genetic aetiology • (most common outcome…)
Indirect Association & LD D M1 M2 Mn Assess trait effects on D via correlated markers (Mi) rather than susceptibility/etiologic variants. Indirect and Direct Allelic Association Direct Association D * Measure disease relevance (*) directly, ignoring correlated markers nearby Semantic distinction between Linkage Disequilibrium: correlation between (any) markers in population Allelic Association: correlation between marker allele and trait
How far apart can markers be to detect association? Expected decay of linkage disequilibrium Dt = (1 – q)tD0
Decay of Linkage Disequilibrium Reich et al., Nature 2001
Variability in LD overwhelms the mean: D’
Average Levels of LD along chromosomes CEPH W.Eur Estonian Chr22 Dawson et al Nature 2002
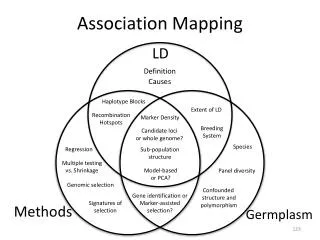
Mean trends along chromosomes Average LD decay vs physical distance Haplotype Blocks Characterizing Patterns of Linkage Disequilibrium
Linkage Disequilibrium Maps & Allelic Association D 1 2 3 n Marker LD Primary Aim of LD maps: Use relationships amongst background markers (M1, M2, M3, …Mn) to learn something about D for association studies Something = * Efficient association study design by reduced genotyping * Predict approx location (fine-map) disease loci * Assess complexity of local regions * Attempt to quantify/predict underlying (unobserved) patterns ···
Feb 02 April 04 Oct 04 Sept 01 April 1999 – Dec 01 Oct 2002 - present Building Haplotype Maps for Gene-finding 1. Human Genome Project Good for consensus, not good for individual differences 2. Identify genetic variants Anonymous with respect to traits. 3. Assay genetic variants Verify polymorphisms, catalogue correlations amongst sites Anonymous with respect to traits
HapMap Strategy • Samples • Four populations, small samples • Genotyping • 5 kb initial density across genome (600K markers) • Subsequent focus on low LD regions • Recent NIH RFA for deeper coverage
Hapmap validating millions of SNPs. Are they the right SNPs? Distribution of allele frequencies in public markers is biased toward common alleles Expected frequency in population Frequency of public markers Updated with phase 2—more similar to expectation Phillips et al. Nat Genet 2003
Common-Disease Common-Variant Hypothesis Common genes (alleles) contribute to inherited differences in common disease Given recent human expansion, most variation is due to old mutations that have since become common rather than newer rare mutations. Highly contentious debate in complex trait field
Common-Disease/Common-Variant For Against Wright & Hastie, Genome Biol 2001
Potential genetic architectures? We would have found already Mendelian Effect size Small Large Hard Stuff HapMap Rare Common Allele frequency
If this scenario, properly designed association studies can work If this scenario, association studies will not work Taken from Joel Hirschorn presentation, www.chip.org
Haplotype Tagging for Efficient Genotyping Cardon & Abecasis, TIG 2003 • Some genetic variants within haplotype blocks give redundant information • A subset of variants, ‘htSNPs’, can be used to ‘tag’ the conserved haplotypes with little loss of information (Johnson et al., Nat Genet, 2001) • … Initial detection of htSNPs should facilitate future genetic association studies
Summary of Role of Linkage Disequilibrium on Association Studies • Marker characterization is becoming extensive and genotyping throughput is high • Tagging studies will yield panels for immediate use • Need to be clear about assumptions/aims of each panel • Density of eventual Hapmap probably cover much of genome in high LD, but not all Challenges • Just having more markers doesn’t mean that success rate will improve • Expectations of association success via LD are too high. Hyperbole! • Need to show that this information can work in trait context
Outline • Association and linkage • Association and linkage disequilibrium • History and track record • Challenges • Example
Association Studies: Track Record • Pubmed: Mar 2005. “Genetic association” gives 20,096 hits—updated Mar 2006 36,908 • Q: How many are real? • A: < 1% • Claims of “replicated genetic association” 183 (0.9%) 383 (1%) • Claims of “validated genetic association” 80 hits (0.3%) 156 (0.4%)
Association Study Outcomes Reported p-values from association studies in Am J Med Genet or Psychiatric Genet 1997 Terwilliger & Weiss, Curr Opin Biotech, 9:578-594, 1998
Why limited success with association studies? • Small sample sizes results overinterpreted • Phenotypes are complex and not measured well. Candidate genes thus difficult to choose • Allelic/genotypic contributions are complex. Even true • associations difficult to see. • Population stratification has led clouded true/false positives
Phenotypes are Complex Weiss & Terwilliger, Nat Genet, 2000
Many Forms of Heterogeneity Terwilliger & Weiss, Curr Opin Biotechnol, 1998
Main Blame Why do association studies have such a spotted history in human genetics? Blame: Population stratification Analysis of mixed samples having different allele frequencies is a primary concern in human genetics, as it leads to false evidence for allelic association.
Population Stratification • Leads to spurious association • Requirements: • Group differences in allele frequencies AND • Group differences in outcome • In epidemiology, this is a classic matching problem, with genetics as a confounding variable Most oft-cited reason for lack of association replication
Population Stratification + c21 = 14.84, p < 0.001 Spurious Association
Population Stratification: Real Example Reviewed in Cardon & Palmer, Lancet 2003
1/2 3/4 1/3 ‘Control’ Samples in Human Genetics < 2000 • Because of fear of stratification, complex trait genetics turned away from case/control studies • - fear may be unfounded • Moved toward family-based controls (flavour is TDT: transmission/disequilibrium test) “Case” = transmitted alleles = 1 and 3 “Control” = untransmitted alleles = 2 and 4
TDT Advantages/Disadvantages Advantages Robust to stratification Genotyping error detectable via Mendelian inconsistencies Estimates of haplotypes possible Disadvantages Detection/elimination of genotyping errors causes bias (Gordon et al., 2001) Uses only heterozygous parents Inefficient for genotyping 3 individuals yield 2 founders: 1/3 information not used Can be difficult/impossible to collect Late-onset disorders, psychiatric conditions, pharmacogenetic applications