Download
1 / 24
240 likes | 449 Views
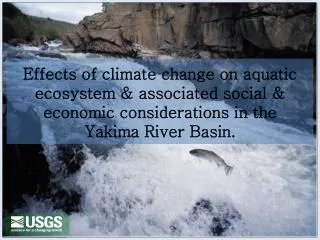
Comparison of Simulated Runoff in the Yakima River Basin, Washington for Present and Global Climate-Change Conditions. Watershed and River Management Program (WaRSMP) Description of Yakima River Basin and Yakima Storage Project MMS and Yakima River Basin models

E N D
Comparison of Simulated Runoff in the Yakima River Basin, Washington for Present and Global Climate-Change Conditions • Watershed and River Management Program (WaRSMP) • Description of Yakima River Basin and Yakima Storage Project • MMS and Yakima River Basin models • Global Climate-Change assumptions • Comparison of Watershed simulations—present versus GCC scenarios Warren Sharp Mark Mastin
Watershed and River System Management Program (WARSMP) • Cooperative USGS / Bureau of Reclamation program • Purpose is research, development, and implementation of a Decision Support System to achieve equitable balance among water resource issues.
Database-centered Decision Support System RiverWare System River and Reservoir Management Models Long-term Mid term Short-term Planning Operations Operations Data Sources Hydrometeorological Environmental Physical/ chemical Spatial Data Management System (HDB) Hydrologic Database Query, Display, and Analysis GIS Statistics Risk GIS Weasel Modular ModelingSystem (MMS) Watershed and Ecosystem Models
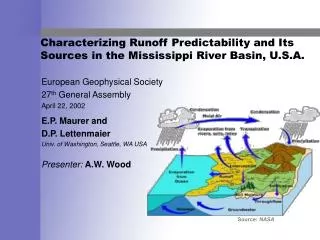
Yakima River Basin Numbers Water Balance Ave. Precip. (27 inches) = 8.7 million ac-ft 12,000 cfs Unregulated runoff = 4.0 million ac-ft 5,600 cfs Regulated runoff = 2.6 million ac-ft 3,600 cfs Water Demand = 2.5 million ac-ft 65% unregulated runoff Storage = 1.06 million ac-ft 26% unregulated runoff Miscellaneous • Drainage Area = 6,200 sq. miles, ranging from 400 to 8,000 ft. • Rainfall varies from 90 inches in the Cascades to 6 inches in the lower basin • About 45% of water diverted for irrigation becomes return flow • During low-flow season about 75% of the volume is return flow
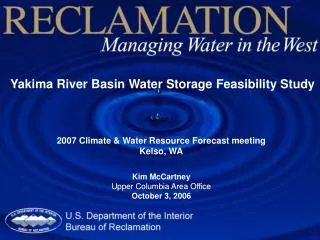
Yakima Storage Study two • Evaluate four storage projects in terms of how will they improve fisheries • Bumping Lake enlargemnent • Wymer Dam • Keechelus to Kachess pipeline • Black Rock Reservoir—$3.5-4.0 Billion, 1.3 million acre feet
Global Climate Change-- Pacific Northwest By 2020 +3.1ºF (+1.72ºC) By 2050 +5.3ºF (+2.9ºC) (Climate Impact Group, Mote and others, 1999, Impacts of Climate Variability and Change, Pacific Northwest)
Global Climate Change-- Pacific Northwest “Projections of temperature changes, both globally and regionally, are made with higher confidence than precipitation changes.” (Climate Impact Group, Mote and others, 1999, Impacts of Climate Variability and Change, Pacific Northwest)
Global Climate Change-- Pacific Northwest • For this study: • Global Climate Change (GCC) Scenario • +3.6ºF (+2.0ºC) increase in air temperature • throughout the year • Present Unregulated Flow (PUF) scenario • represented by the average simulated runoff for • 1950-2005 water years • Precipitation was not change for the GCC scenario
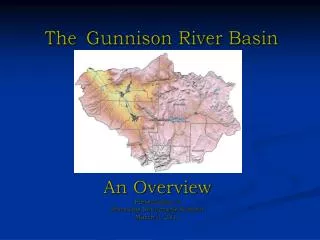
Modeling Units • About 95 percent of the runoff at Yakima River near Parker is generated from the four modeling units: • Upper Yakima • Naches • Toppenish/Satus • Yakima Canyon
Upper Yakima Modeling Unit • Upper Yakima Modeling Unit • 404 MRUs • 17 subbasins • 21 nodes • 14 precipitation inputs • 13 temperature inputs • over 54,000 parameters
Simulation Results April thru August Runoff
GCC scenario versus PUF scenario April 1 Snowpack 1,945,000 acre-feet 803,000 acre-feet
GCC scenario versus PUF scenario April 1 Snowpack
GCC scenario versus PUF scenario Yakima River near Parker Discharge, in ft3/s
Conclusions Compared to PUF scenarios, GCC scenarios have: • Seasonal patterns of higher flows in late autumn and winter, peaks earlier in the water year, and low spring and summer runoff • Spring snowpack less with biggest percent differences in the lower elevations • Total median , April-August runoff about 770,000 ac-ft less at Parker • Median total volumes of runoff probably manageable • However, at least 10% of the water years can be expected to generate less runoff than the lowest observed runoff (1950-2005) and will likely provide significant challenges to water managers.
More Information http://wwwbrr.cr.usgs.gov/warsmp http://wwwbrr.cr.usgs.gov/mms http://wwwbrr.cr.usgs.gov/weasel