Download
1 / 26
260 likes | 703 Views
The Gunnison River Basin. An Overview Presentation to Statewide Roundtable Summit March 3, 2011. Gunnison River Basin. Gunnison River Basin Significant Water Rights. Gunnison River Basin. Diverse communities making beneficial use of all available water Agriculture Municipal and Domestic

E N D
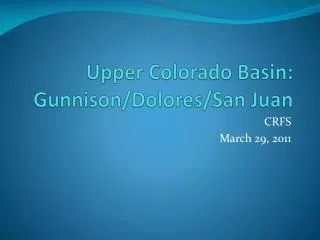
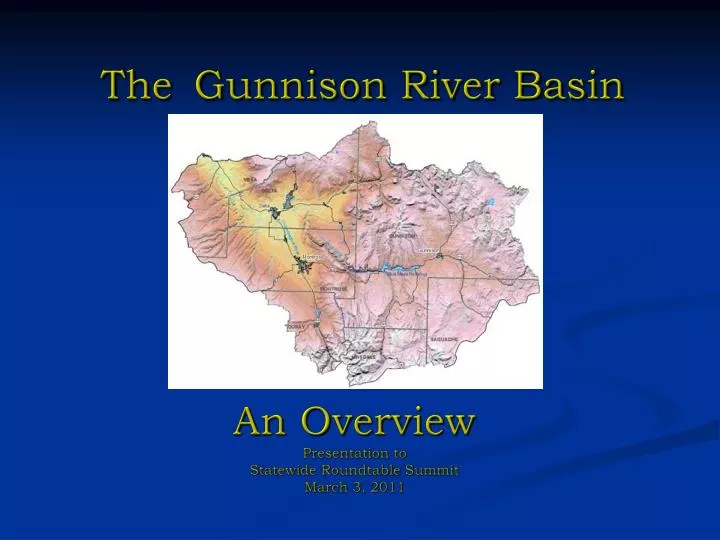
TheGunnison River Basin An Overview Presentation to Statewide Roundtable Summit March 3, 2011
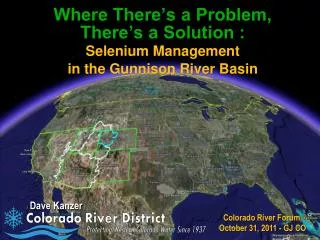
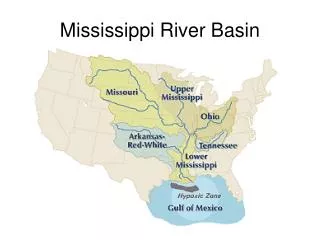
Gunnison River Basin Source: Bureau of Reclamation
Gunnison River Basin Diverse communities making beneficial use of all available water Agriculture Municipal and Domestic Recreation and Tourism Coal Mining Hydropower Generation
Gunnison River BasinUpper Basin Agriculture • Livestock and hay production • 66,486 irrigated acres • 578,380 acre-feet average annual diversions • 72,481 acre-feet annual consumptive use • 97% of current water diversions • $46.2 million annually Diverse communities making beneficial use of all available water
Gunnison River BasinLower Basin Agriculture Uncompahgre Project Taylor Park Reservoir, Gunnison Tunnel, 7 diversion dams, 128 miles of main canals, 438 miles of laterals, 216 miles of drains. Supplies 76,300 acres of irrigated lands. Principal crops are alfalfa, wheat, corn, oats, beans, barley, onions and fruit.
Gunnison River BasinLower Basin Agriculture North Fork Region 281,889 acres dedicated to agriculture 346,000 apple trees, 22,000 pear trees, 107,000 peach trees, 97,000 grape vines Other principal crops are hay, corn, dry beans, squash, and vegetables Total crop value (2002) $16,551,000 Livestock includes cattle, buffalo, elk, llamas, exotic birds
Gunnison River BasinMunicipal and Domestic Uses Municipal Providers Gunnison, Crested Butte, Mt. Crested Butte Water & Sanitation District, Crested Butte South W&SD, Skyland Lake City Project 7 Water Authority Orchard City, Hotchkiss, Paonia 12,000 Domestic wells Diverse communities making beneficial use of all available water
Gunnison River BasinRecreation Flat water Recreation Curecanti National Recreation Area One million visitor days per year $35.51 in direct spending, supported: $40.86 million in sales $14.89 million in personal income 888 jobs $23.44 million in value added Taylor Park Reservoir Lake San Cristobal Ridgway Reservoir Crawford State Park Grand Mesa Paonia
Gunnison River BasinRecreation Stream Fishing Kayaking Canoeing Rafting Snow Making
Gunnison River BasinCoal Mining Total Production 16,140,389 tons Total Sales Value $403,559,867 • Property taxes • $4,361,319 • Employee pay and Benefits • $93,805,041 • Supplies and Services • $88,338,000 • Direct water use in production • 1,200 acre-feet per year
Gunnison River BasinHydropower Aspinall Unit Power Plants Blue Mesa Outlet capacity 6,100 c.f.s. 60 Megawatts (load following) Morrow Point Outlet capacity 5,000 c.f.s. 156 Megawatts (load following) Crystal Outlet capacity 4,150 c.f.s. 29 Megawatts (base unit)
Federal Reserved Water RightBlack Canyon of the Gunnison National Park The federal reserved water right doctrine March 2, 1933 National Park Service photo by Lisa Lynch
Decreed Settlement to Quantify Black Canyon Water Right Base flow: Year-round at 300 c.f.s. Peak flow: one-day peak 1,300 – 14,000 c.f.s. - determined annually by a formula based on forecasted unregulated April through July inflow to Blue Mesa Reservoir Shoulder flows 85 day period
Gunnison River BasinCurrent Challenges Aspinall Unit Operations – Preliminary Final EIS Selenium
Reoperation of the Aspinall Unit Reservoirs Endangered Species Act Endangered fish and habitat – Gunnison and Colorado Rivers Environmental Impact Statement
Fish and Wildlife Service Flow Recommendations to Benefit Endangered Fish
Fish and Wildlife Service Flow Recommendations to Benefit Endangered Fish
Fish and Wildlife Service Flow Recommendations to Benefit Endangered Fish
Gunnison River BasinLong-Term Challenges Growth Colorado River Compact Compliance Climate Disturbance
Gunnison River BasinGrowth Population increase to 2050 projected to be 96-129% - to >200,000 Projected increase in gross water demand by 2030 is 14,900 acre-feet (underestimates municipal requirements in North Fork Region) Virtually the entire Gunnison Basin is already over-appropriated (due to historic shortages at Redlands Power Canal near Grand Junction)
Gunnison River BasinColorado River Compact Compliance Colorado River Basin Upper Basin Wyoming Utah Colorado New Mexico Lower Basin Nevada Arizona California
Gunnison River BasinColorado River Compact Compliance Navajo Reservoir Flaming Gorge Reservoir Blue Mesa Reservoir 8.23 million acre-feet Inflows to Lake Powell Percentage of 30-year average • 2000 – 62% • 2001 – 59% • 2002 – 25% • 2003 – 51% • 2004- 49% • 2005 – 105% • 2006 – 71% • 2007 – 68% Lowest 8-year average in 100 years Lake Powell
Blue Mesa Reservoir Impact of a dry year 2007 2002