Download
1 / 19
190 likes | 308 Views
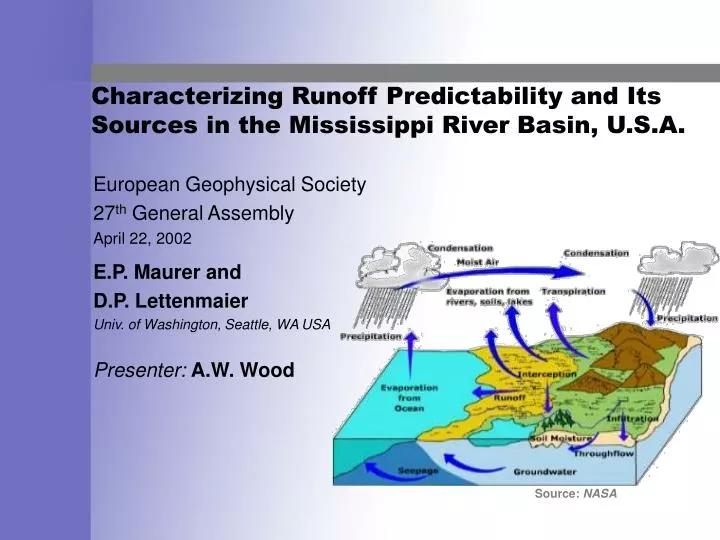
Characterizing Runoff Predictability and Its Sources in the Mississippi River Basin, U.S.A. European Geophysical Society 27 th General Assembly April 22, 2002 E.P. Maurer and D.P. Lettenmaier Univ. of Washington, Seattle, WA USA Presenter: A.W. Wood. Source: NASA. Motivation.

E N D
Characterizing Runoff Predictability and Its Sources in the Mississippi River Basin, U.S.A. European Geophysical Society 27th General Assembly April 22, 2002 E.P. Maurer and D.P. Lettenmaier Univ. of Washington, Seattle, WA USA Presenter: A.W. Wood Source: NASA
Motivation • Better observation and prediction of climate signals and their teleconnections to land areas • Improved understanding of continental-scale hydrologic variability through data collection and modeling • Potential benefits of improved long-lead prediction
Outline of Study • Describe Variability of Land Surface Water Budget • Observations • Modeling • Determine Relative Long-Lead Hydrologic Predictability attributable to: • Initial State of Land Surface • Remote Climate Forcing • Identify where and when the greatest improvement in seasonal forecasts might be expected with improved observations.
The Land-Surface Water Budget Examine variability in water budget components E P (Near Surface) Water Balance Equation W Q Need long records of observations to define variability and predictability
Precipitation and Evaporation Observations Ameriflux (flux towers) provides measurements of E, since mid 1990’s Precipitation appears well defined, generally since 1948 U.S. Station Density: 1 per 130,000 km2 U.S. Station density: 1 per 700 km2
Snow Water and Soil Moisture Observations • About 600 SNOTEL sites in western US • Snow water content measured since 1977 • Spatial coverage poor at continental scale
Runoff (Streamflow) Observations • Streamflow in the U.S. measured at roughly 7,000 active gauging stations. • Stations can represent regulated flow conditions • Streamflow is a spatially integrated quantity
Hydrologic Model Drive a Hydrologic Model with well-known P, T, reproduce Q, derive snow, soil moisture, ET • VIC Model Features: • Developed over 10 years • Energy and water budget closure at each time step • Multiple vegetation classes in each cell • Sub-grid elevation band definition (for snow) • Subgrid infiltration/runoff variability
Model Obs. 6 Sample Hydrographs • Good agreement of • Seasonal cycle • Low Flows • Peak Flows
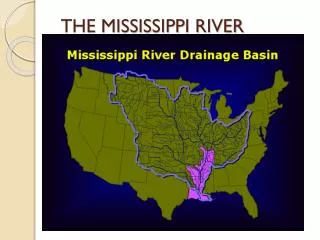
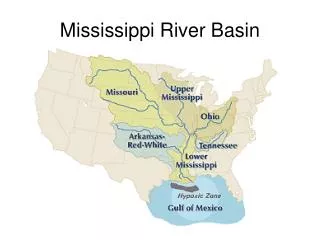
Case Study - Estimation of Runoff Predictability Mississippi River Basin • Strong gradient in precipitation and runoff • Winter runoff concentrated in SE • High snowmelt runoff in summer
Lead-4 Lead-3 Lead -2 Lead 1 Lead-0 Forecast Season DJF M A N F M A J J S O D J Dec 1 Mar 1 Jun 1 Sep 1 Dec 1 Initialization Dates for DJF Forecast Methods for Determining Runoff Predictability • Indices Characterizing Sources of Predictability: • SOI – An index identifying ENSO phase • AO – An index of phase of the Arctic Oscillation • SM – Soil moisture level (normalized) • SWE – Snow water equivalent (normalized) • Varying Lead Times between IC and Forecast Runoff • Only Use Indices in Persistence Mode Climate Land
Runoff r2SM r2SOI SOI SM Methods 2 • Multiple linear regression used between IC and runoff • Variance explained (r2) indicates level of predictability • Variables introduced in order • of how well indices represent • current knowledge of state: • SOI/AO • SWE • SM • Incremental predictability
Methods 3 Test for Significant Predictability (r2) in 2 steps • Local Significance: • Tested at each grid cell • Accounts for temporal autocorrelation • 95% confidence level estimated • Field Significance (Livezey and Chen, 1983): • Tests area showing local significance over entire basin • Accounts for limited sample size, spatial correlation in both predictors and predictand • 95% confidence for field significance
Total Runoff Predictability Lead, months 1.5 4.5 7.5 10.5 13.5 • Uses all 4 indices to predict runoff • “X” no field significance • Predictability deteriorates with time
Predictability due to Climate Signals • Predictors currently available • Moderate levels of r2 • Greater influence in winter, in area and lead time • Difficulty in long-lead persistence prediction with climate signals
Predictability Due to Snow • r2 represents incremental increase • Focus at 1 or more season lead is in Rocky mountains • At level of Mississippi basin, predictability limited to 1-2 seasons • Analysis by sub-area could reveal greater predictability
Predictability due to Soil Moisture • Widespread predictability at 0 lead (1½ month) • Winter Runoff: little predictability where runoff is high • Summer Runoff: limited predictability to 3 seasons
3 season lead: climate signal provides predictability of winter runoff in SE 2 season lead: Important predictability limited Snowmelt signal in W mountains 1 season lead: mild climate influence in SE snow influence on summer runoff in W 0 season lead: soil moisture signal dominant snow signal dominant in W in summer climate signal strong in SE in winter Scaled Runoff Predictability
Conclusions • At a lead-0 (1.5 month), soil moisture is dominant for predictive capability of runoff • At lead times over 1 season, limited potential forecast skill due to snow in west and climate signal in east • Important runoff forecast skill at long lead times is limited, and due to modest predictive skill in areas with high runoff