Download
1 / 1
20 likes | 254 Views
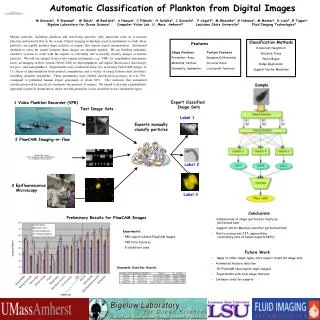
An Automatic System for Classification of Nuclear Sclerosis from Slit-Lamp Photographs. Shaohua Fan, Charles Dyer Larry Hubbard, Barbara Klein Department of Computer Sciences Department of Ophthalmology & Visual Sciences University of Wisconsin-Madison. Abstract:

E N D
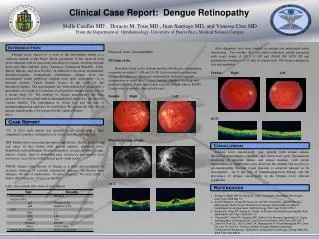
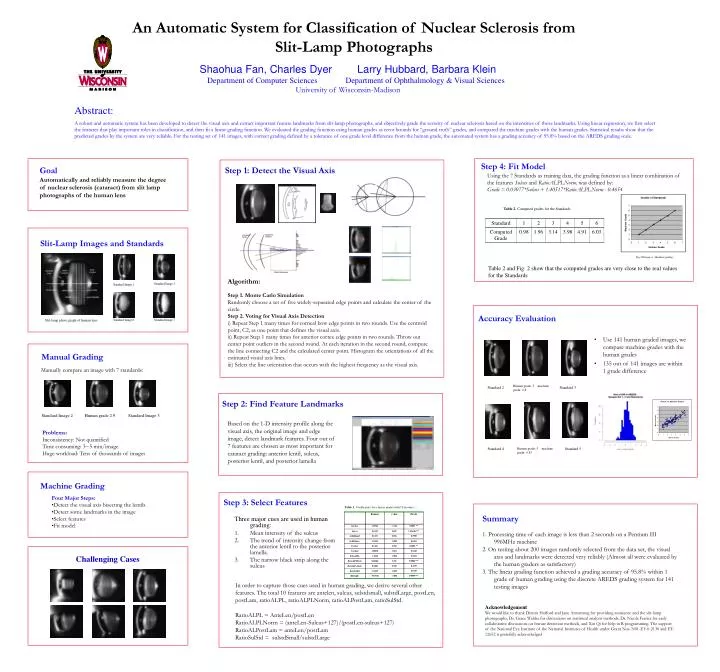
An Automatic System for Classification of Nuclear Sclerosis from Slit-Lamp Photographs Shaohua Fan, Charles Dyer Larry Hubbard, Barbara Klein Department of Computer Sciences Department of Ophthalmology & Visual Sciences University of Wisconsin-Madison Abstract: A robust and automatic system has been developed to detect the visual axis and extract important feature landmarks from slit-lamp photographs, and objectively grade the severity of nuclear sclerosis based on the intensities of those landmarks. Using linear regression, we first select the features that play important roles in classification, and then fit a linear grading function. We evaluated the grading function using human grades as error bounds for “ground truth” grades, and compared the machine grades with the human grades. Statistical results show that the predicted grades by the system are very reliable. For the testing set of 141 images, with correct grading defined by a tolerance of one grade level difference from the human grade, the automated system has a grading accuracy of 95.8% based on the AREDS grading scale. Step 4: Fit Model Goal Automatically and reliably measure the degree of nuclear sclerosis (cataract) from slit lamp photographs of the human lens Step 1: Detect the Visual Axis Using the 7 Standards as training data, the grading function as a linear combination of the features Sulcus and RatioALPLNorm, was defined by: Grade = 0.03077*Sulcus + 1.40517*RatioALPLNorm - 0.4654 Table 2. Computed grades for the Standards Slit-Lamp Images and Standards Fig 2 Human vs. Machine grading Table 2 and Fig. 2 show that the computed grades are very close to the real values for the Standards Algorithm: Step 1. Monte Carlo Simulation Randomly choose a set of five widely-separated edge points and calculate the center of the circle. Step 2. Voting for Visual Axis Detection i) Repeat Step 1 many times for corneal bow edge points in two rounds. Use the centroid point, C2, as one point that defines the visual axis. ii) Repeat Step 1 many times for anterior cortex edge points in two rounds. Throw out center point outliers in the second round. At each iteration in the second round, compute the line connecting C2 and the calculated center point. Histogram the orientations of all the estimated visual axis lines. iii) Select the line orientation that occurs with the highest frequency as the visual axis. Accuracy Evaluation Slit-lamp photo graph of human lens • Use 141 human graded images, we compare machine grades with the human grades • 135 out of 141 images are within 1 grade difference Manual Grading Manually compare an image with 7 standards: Human grade: 3 machine grade: 2.8 Standard 2 Standard 3 Step 2: Find Feature Landmarks Standard Image 2 Human grade 2.9 Standard Image 3 Based on the 1-D intensity profile along the visual axis, the original image and edge image, detect landmark features. Four out of 7 features are chosen as most important for cataract grading: anterior lentil, sulcus, posterior lentil, and posterior lamella Problems: Inconsistency: Not quantified Time consuming: 3~5 min/image Huge workload: Tens of thousands of images Standard 4 Human grade: 5 machine grade: 4.83 Standard 5 Machine Grading • Four Major Steps: • Detect the visual axis bisecting the lentils • Detect some landmarks in the image • Select features • Fit model Step 3: Select Features Summary Three major cues are used in human grading: • Mean intensity of the sulcus • The trend of intensity change from the anterior lentil to the posterior lamella. • The narrow black strip along the sulcus 1. Processing time of each image is less than 2 seconds on a Pentium III 996MHz machine 2. On testing about 200 images randomly selected from the data set, the visual axis and landmarks were detected very reliably (Almost all were evaluated by the human graders as satisfactory) 3. The linear grading function achieved a grading accuracy of 95.8% within 1 grade of human grading using the discrete AREDS grading system for 141 testing images In order to capture those cues used in human grading, we derive several other features. The total 10 features are antelen, sulcus, sulstdsmall, sulstdLarge, postLen, postLam, ratioALPL, ratioALPLNorm, ratioALPostLam, ratioSulStd. RatioALPL = AnteLen/postLen RatioALPLNorm = (anteLen-Sulcus+127)/(postLen-sulcus+127) RatioALPostLam = anteLen/postLam RatioSulStd = sulstdSmall/sulstdLarge Acknowledgement We would like to thank Dennis Hafford and Jane Armstrong for providing assistance and the slit-lamp photographs, Dr. Grace Wahba for discussions on statistical analysis methods, Dr. Nicola Ferrier for early collaborative discussions on feature detection methods, and Xin Qi for help in R programming. The support of the National Eye Institute of the National Institutes of Health under Grant Nos. N01-EY-0-2130 and EY-12652 is gratefully acknowledged