Download
1 / 38
380 likes | 628 Views
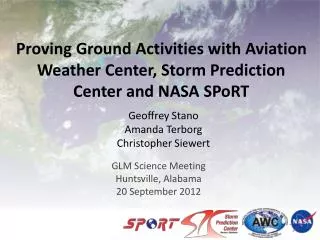
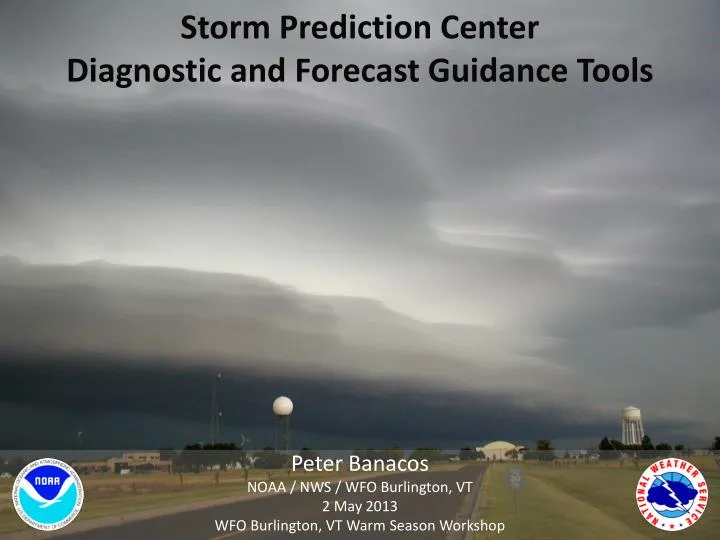
Storm Prediction Center Diagnostic and Forecast Guidance Tools. Peter Banacos NOAA / NWS / WFO Burlington, VT 2 May 2013 WFO Burlington, VT Warm Season Workshop. General comments about mesoscale analysis Review Storm Prediction Center Mesoanalysis Page:

E N D
Storm Prediction CenterDiagnostic and Forecast Guidance Tools Peter Banacos NOAA / NWS / WFO Burlington, VT 2 May 2013 WFO Burlington, VT Warm Season Workshop
General comments about mesoscale analysis • Review Storm Prediction Center MesoanalysisPage: • http://www.spc.noaa.gov/exper/mesoanalysis/ • Review SPC Short-Range Ensemble (SREF) Page: • http://www.spc.noaa.gov/exper/sref/index.php • The SPC Storm-Scale Ensemble of Opportunity: • http://www.spc.noaa.gov/exper/sseo/ Presentation Goals
Mesoanalysis A Key Part of the Diagnostic Process in the Prediction of Severe Thunderstorms… Part I:
Who Do Surface Mesoanalysis? Forecast = diagnosis + trend • Incorrect diagnosis of atmosphere reduces the probability of making a correct forecast • Current operational models poorly predict specific atmospheric characteristics critical in convective forecasting, such as: -- vertical thermodynamic structure (effects of convective parameterization scheme) -- boundary layer conditions -- sub synoptic low-level boundaries -- effects of ongoing convection
Why do Surface Mesoanalysis? (cont.) Mesoanalysis facilitates our ability to synthesize data from a variety of observational sources • Gain a better perspective of actual environmental conditions • Critical to track and identify mesoscaleboundaries This can be done with hand-drawn subjective analyses, or objective analysis available in AWIPS or online (e.g., www.spc.noaa.gov).
Boundaries of Convective Interest across the North Country • • Synoptic Scale Fronts (thermal boundaries) • - cold front, warm front, quasi-stationary front • • Mesoscale Fronts • lake breeze fronts, • convective outflow, • orographic influences • Boundaries, differential heating boundaries owing to • clouds, fog, vegetation, and terrain • • moisture boundaries/discontinuities • • Pressure Troughs • • Convergence Zones
20Z 9 May 2009 -- 8-h NAM FCST Sounding for Montpelier, VT (MPV) Why Mesoanalysis Matters (cont.) Strong bulk shear… Little CAPE (17 J/kg)?
Diagnosis is critical, especially near mesoscale boundaries. Mesoscale boundary 20z 9 May 2010 L KCXX Composite Reflectivity Visible Satellite Image
Often mesoscale details don’t reveal themselves until just hours prior to an event. “The Edge” Let the buyer of model data beware… 9 May 2009 19 UTC RUC Analysis CAPE KMPV 091951Z AUTO 19005KT 10SM FEW049 SCT110 22/11 A2947 RMK AO2 LTG DSNT W-NE SLP978 T02220111 (…resulted in much more CAPE than forecast!)
9 May 2009 Storm Reports EF-1 tornado
SPC MesoanalysisPage Available every hour. Use as a compliment to AWIPS-based LAPS parameters. Based on Rapid Refresh (RAP-40) 1-hour forecast (background field), and adjusted with current hour’s METARs. The RAP is a version of the WRF model with ARW core. Two-pass Barnes run at :05past each hour. 10 Sectors covering the CONUS in real-time. Each gridpoint is post-processed with a sounding analysis routine called NSHARP to calculate many technical diagnostic fields related to severe storms. National archive also available for severe weather case studies (every hour since 18 October 2005): http://www.spc.noaa.gov/exper/ma_archive/ www.spc.noaa.gov
A cornucopia of “indices” Convective Available Potential Energy (CAPE)* Lifted Index (LI)* Total Totals (TT) Convective Inhibition (CIN)* HI = Haines Index* HMI = Hybrid Microburst Index K Index (KI) Bulk Richardson Number (BRN)* LSI = Lid Strength Index DCI = Deep Convective Index Showalter Index (SI) Bulk Richardson Number Shear (BRNSHR) TQ Index = for “low-topped instability” Severe Weather Threat (SWEAT) Bulk Vertical Wind Shear* CAP Strength (700 mb LI) Indices of Indices Total Vertical Wind Shear* Lapse Rate (LR)* Storm-Relative Wind* Energy-Helicity Index (EHI)* Storm-Relative Helicity(SRH)* Relative Humidity (RH)* Vorticity Generation Parameter (VGP)* Downdraft CAPE (DCAPE) Supercell Composite Parameter (SCP)* Lifted Condensation Level (LCL)* Normalized CAPE (nCAPE)* Significant Tornado Parameter (STP)* Level of Free Convection (LFC)* Significant Hail Parameter (SHIP) Equilibrium Level (EL)* Wind Index (WINDEX) Significant Severe Parameter (SSP) Wet Bulb Zero (WBZ) Dry Microburst Index (DMI) Strong Tornado Parameter (STP) Melting Level (MLT) Theta-E Index (TEI) Warm Cloud Depth (WCD)* Microburst Day Potential Index (MDPI) Precipitable Water (PW)* Wet Microburst Severity Index (WMSI) Equivalent Potential Temperature (e)* Moisture Flux “Convergence” (MFC)* * Can be calculated over many different layers/levels/parcels
Can summarize large amounts of data. • Can serve as good approximations for thunderstorm ingredients (moisture, instability, lift) • Can quickly draw attention to “critical” areas for further diagnosis. • All are attractive when under time pressure. Convective Indices - Advantages
Not necessarily forecast parameters; may only be diagnostics (i.e., represent the current state, not necessarily representative of 3 hrs ahead, or even 1 hr ahead) • Most indices are not rigorously developed or validated – arbitrarily combined variables • Most indices were developed somewhere other than New England. (applicability? Were they tested locally?) Convective Indices - Limitations
Can lead to faulty perceptions of atmosphere via over-simplification Little value in isolation; for combined variables - different combos can produce similar values Flavor of the parameter? (e.g., EHI and its inputs) Constituents can evolve quasi-independently Action often occurs at “The Edge” – upcoming slide In the 0-6 hr time frame…be prepared to change as the data changes. Convective Indices - Limitations
SBCAPE: Surface Based. Uses the surface temperature and dew point. Will show large diurnal swings. Can give significant overestimates (an order of magnitude) in cases of shallow moisture and underestimates in cases of elevated convection.
MLCAPE: Mean Layer. Uses the mean temperature and mean mixing ratio in the lowest part of the atmosphere (SPC uses lowest 100 mb). Less variable in time and space, and more conservative than MUCAPE when lower atmosphere is not well mixed.
MUCAPE: Most Unstable Parcel. Uses most unstable parcel in lower atmosphere (SPC uses lowest 300mb). Helps with nocturnal or other types of elevated convection.
The NCAPE (Normalized CAPE) is CAPE that is divided by the depth of the buoyancy layer (units are m s-2) - Values of 0.1 or lower generally mean a tall “skinny” CAPE. Small/slower updraft accelerations likely (Sounding B). Heavy rain potential if high PW present. - Values closer to 0.3 to 0.4 indicate a “fat” CAPE profile and the potential for fast parcel accelerations (Sounding A). The 1 June 2011 EF-3 tornado day had NCAPE ~0.37ms-2. Conceptualizing Normalized CAPE
A Severe Weather Normalized CAPE with EML (0.37ms-2) 1600 UTC 1 June 2011 Albany, NY (ALB) sounding modified for 1853 UTC surface temperature and dewpoint at Westfield, MA (BAF).
11 July 2007 – 0h RUC forecast valid 18z for Montpelier, VT (MPV) MBE/Corfidi Vector magnitude around 5 kts. Also saw terrain influences. Heavy Rain Example Tall/thin CAPE profile (1200 J/kg), minimal CAPE in hail growth layer. 0C
Flash Flooding Barre, VT 11 July 2007, 17z
SREF Page: http://www.spc.noaa.gov/exper/sref/index.php Used extensively for convective outlooks at SPC since ~ 2003 Run 4 times per day (03, 09, 15, 21z); forecasts out to 87 hours 22 members (10 NAM, 5 RSM, 6 WRF, time-lagged operational WRF-NAM) Horizontal resolution varies 32-45 km (lower than operational runs) Output: mean & spread (standard deviation), probability, spaghetti (every 3 hrs) Also produced calibrated output based on verification in recent weeks. Part II: NCEP Short-Range Ensemble (SREF) (Weiss et al., 2006)
SPC SREF Page Nomenclature [PR]: Probabilistic value. The probability may be an uncorrected exceedance probability, a "combined" or joint probability, or a post-processed calibrated probability. [MAX]: The maximum value from any member at each grid point. [MD]: The median value at each grid point. [MDXN]: The median at each grid point (solid contours) along with the union (i.e., maximum in spatial extent) and the intersection (i.e., minimum in spatial extent) overlaid. This plot shows a measure of SREF central tendency using the median, and spatial variability via the union and intersection of all the members. [MIN]: The minimum value from any member at each grid point. [MN]: The ensemble mean; i.e., the mean value at each grid point. [MNSD]: The ensemble mean and standard deviation at each grid point. [SP]: Spaghetti diagram.
Calibrated Thunderstorm Probabilities are very useful… SREF Page Calibrated Probability of Thunderstorm Calibrated Probability of Severe Thunderstorm
NUMERICAL GUIDANCE : Calibrated ensemble forecasts Ensemble forecasts are a set of forecasts all valid at the same time and made using either (1) different models and / or (2) the same model with different initial conditions, parameter settings, etc. Ensemble probability of 3-hr precip> .01” 27 hrfcst, valid period: 0300Z 28 Apr to 0600Z 28 Apr 2013 Ensemble mean precip = 0.01” (thick dashed)
NUMERICAL GUIDANCE : Calibrated ensemble forecasts Cloud Physics Thunder Parameter (CPTP) was developed to refine thunderstorm forecasts based on more traditional model-generated parameter fields such as CAPE Ensemble probability of CPTP > 1 27 hrfcst, valid period: 0300Z 28 Apr to 0600Z 28 Apr 2013 Highlights where thermodynamic and microphysical environment supports cloud electrification… Ensemble probability of CPTP > 1 (thick dashed)
Cloud Physics Thunder Parameter (CPTP) Bright et al. (2005)
NUMERICAL GUIDANCE : Calibrated ensemble forecasts A composite ensemble forecast of thunderstorm potential; it is the product of the two previous ensemble forecasts EnsProb (Precip> .01”) x EnsProb (CPTP > 1) 27 hrfcst, valid period: 0300Z 28 Apr to 0600Z 28 Apr 2013 UncalibratedCombined Probability
NUMERICAL GUIDANCE : Calibrated ensemble forecasts Composite model forecast of the previous slide has been calibrated (i.e., modified) by performance of that same parameter in recent weeks vs. NLDN Data (see Bright et al. 2005) Calibrated ensemble tstm parameter 27 hrfcst, valid period: 0300Z 28 Apr to 0600Z 28 Apr 2013
NUMERICAL GUIDANCE : Calibrated ensemble forecasts Verification Example EnsProb (Precip> .01”) x EnsProb (CPTP > 1) 15 hrfcst, valid period: 2100Z 31 Aug to 0000Z 1 Sept 2004
NUMERICAL GUIDANCE : Calibrated ensemble forecasts Composite model forecast of the previous slide has been calibrated (i.e., modified) by performance of that same parameter in recent weeks (see Bright et al. 2004) Calibrated ensemble tstm parameter 15 hrfcst, valid period: 2100Z 31 Aug to 0000Z 1 Sept 2004 Observed lightning strikes (yellow crosses)
Storm-Scale Ensemble of Opportunity (SSEO) • High resolution model “consensus tool” (combine everything into one graphic). Practical alternative to a formal storm-scale ensemble. Part III: • Post-processing of 7 deterministic convective allowing model runs (no convective parameterization scheme). • Currently only based on 00z model runs. 3-hr spaghetti of composite reflective > 40 DBZ Good for showing/understanding consensus of very high-resolution models. Good for display of timing differences between models.
Convection Allowing Models included in SSEO Emphasis on “Hourly Maximum Fields” (HMFs) (1) 1-km AGL simulated reflectivity Use: Diagnosing convective mode & intensity (2) Updraft Helicity Use: For representing a rotating updraft in a simulated storm (3) Updraft Speed Use: Measure of convective intensity (4) 10-m AGL Wind Speed Use: Identifying conective wind gusts