Download
1 / 21
210 likes | 340 Views
Storm Surge Prediction, Tsunamis and Estuaries. November 5. Storm Surge = Storm Tide (Observed Water Level) – Astronomical (Predicted) Tide - Does not include waves. http://www.floridadisaster.org/bpr/Response/Plans/Nathaz/hurricanes/storm_surge.htm. Storm Surge Animations at

E N D
Storm Surge = Storm Tide (Observed Water Level) – Astronomical (Predicted) Tide - Does not include waves http://www.floridadisaster.org/bpr/Response/Plans/Nathaz/hurricanes/storm_surge.htm
Storm Surge Animations at http://openioos.org/hurricane/retro/2005/latest_anim.html?d=archive/katrina Consistent Vertical Datum essential to monitoring, modeling, and mitigating storm surge Emergency Managers need water level relative to NAVD88 to estimate inundation Storm surge models use Mean Sea Level as datum – some use NGVD29 which was MSL in 1929 – have to adjust to present MSL then to NAVD88 Surge models use bathymetry referenced to MLLW – must adjust this to model datum (MSL)
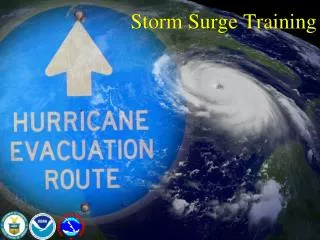
Sea, Lake, and Overland Surges from Hurricanes (SLOSH) model There are 14 SLOSH Basins that cover the State of Florida
SLOSH model Envelope of High Water (EOHW) for Hurricane Dennis (8/05)
Tsunamis • Tsunamis are low-frequency ocean waves generated by submarine earthquakes. The sudden motion of seafloor over distances of a hundred or more kilometers generates waves with periods of around 12 minutes. • The waves are not noticeable at sea, but after slowing on approach to the coast, and after refraction by subsea features, they can come ashore and surge to heights ten or more meters above sea level. • the Alaskan tsunami on 1 April 1946 destroyed the Scotch Cap lighthouse 31m above sea level. • Wave travels at Shallow Water Gravity Wave speed: • Arrival times predictable – Farther from source, longer warning time
Figure 17.8 in Stewart. Tsunami wave height four hours after the great M9 Cascadia earthquake off the coast of Washington on 26 January 1700 calculated by a finite-element, numerical model. Maximum open-ocean wave height, about one meter, is north of Hawaii. From Satake et al. (1996).
Figure 17.7 in Stewart. (a) Hourly positions of leading edge of tsunami generated by a large earthquake in the Aleutian Trench on April 1, 1946 at 12h 58.9m GMT. (b) Maximum vertical extent of tsunami on Oahu Island in Hawaii and the calculated travel time in hours and minutes from the earthquake epicenter. (c) & (d) Tide gauge records of the tsunami at Honolulu and Valparaiso. From Dietrich, et al. (1980).
Sumatra Tsunami: On the morning of December 26, 2004 a magnitude 9.3 earthquake struck off the Northwest coast of the Indonesian island of Sumatra. The earthquake resulted from complex slip on the fault where the oceanic portion of the Indian Plate slides under Sumatra, part of the Eurasian Plate. The earthquake deformed the ocean floor, pushing the overlying water up into a tsunami wave. The tsunami wave devastated nearby areas where the wave may have been as high as 25 meters (80 feet) tall and killed nearly 300,000 people from nations in the region and tourists from around the world. The tsunami wave itself also traveled the globe, and was measured in the Pacific and many other places by tide gauges. Measurements in California exceeded 40 cm in height, while New Jersey saw water level fluctuations as great as 34 cm. Links: http://www.dhisoftware.com/general/News/Tsunami/IndianOceanRed2.avi National Center for Tsunami Research: http://nctr.pmel.noaa.gov/indo_1204.html California Tsunami Animation: http://www.usc.edu/dept/tsunamis/video/calvid/
Sumatra Tsunami heights and arrival times http://nctr.pmel.noaa.gov/indo20041226/Figure_1_sign.jpg
DART™ (Deep-ocean Assessment and Reporting of Tsunamis) A DART™ system consists of a seafloor bottom pressure recording (BPR) system capable of detecting tsunamis as small as 1 cm, and a moored surface buoy for real-time communications. An acoustic link is used to transmit data from the BPR on the seafloor to the surface buoy. The data are then relayed via a GOES satellite link to ground stations, which demodulate the signals for immediate dissemination to NOAA's Tsunami Warning Centers and PMEL.
DART™ real-time tsunami monitoring systems, positioned at strategic locations throughout the ocean, play a critical role in tsunami forecasting http://nctr.pmel.noaa.gov/Dart/index.html
Estuaries • Estuaries are semi-enclosed basins where fresh water mixes with ocean water • In Estuary, fresh water measurably dilutes salinity • Tidal mixing is very important for coastal ocean and estuaries • Bathymetry and tidal range determine strength of tidal mixing • Tides drive water in (flood) and out (ebb) of estuary as water rises and falls • Tidal Excursion: how far water parcel moves up/down estuary over a tidal cycle • Tidal Residual circulation is flow averaged over many tidal cycles – net motion of water • Tidal mixing, fresh water inflow, and winds are primary forcing functions for Residual Circulation
Tidal residual flow is “superposed” on tidal flow – driven by fresh water inflow and winds • Fresh water inflow varies on time scales of weeks to seasons to years • Wind-driven effects vary on time scales of 1-5 days – 2 parts: direct and coastal set-up (down) direct: water moves in direction of wind – balance between slope of sea surface and wind stress coastal: large-scale wind effects on coastal ocean changes water level at mouth – changes water level in estuary
1.0 tidal -1.0 2.0 wind -2.0 0.1 mean • So… Instantaneous velocity is the sum of tidal, wind, and mean
A • Tidal asymmetry – max velocity on ebb is different than on flood – duration of ebb is longer than flood due in part to residual (mean) circulation superposed on tide – phase shift with depth – tide turns sooner at surface than at depth • Also due in part to nonlinearity – crest (high tide) travels in deeper water than trough (low tide) – high overtakes low, max velocity doesn’t occur at mid-tide B
0 Top 0 Bottom 0 flood A ebb flood ebb flood B 0 ebb
Head River flow: R → Vo Fresh So Mouth open sea Salty Si ← Vi • Tidal Mixing determines nature of estuary • Fresh water inflow, bathymetry, tidal range determine strength of mixing • Tidal Residual Circulation is required to balance salt in estuary • Salty water flows in at depth, mixes with fresh water in estuary, then flows out as fresher surface flow • Shallower bathymetry, higher tidal range, larger fresh water inflow mean greater mixing
Tidal prism – volume of water that flows in/out during tidal cycle Vp=Area x tidal range • Amount of mixing determines Estuarine flow • Ratio of river input (R) to tidal flow (T) is one measure of mixing: • T=Total Tidal Transport (average) = Vp/(Tidal Period/2)