Download
1 / 16
160 likes | 281 Views
GOES-R Proving Ground Storm Prediction Center and Hazardous Weather Testbed. Demonstrating the Pseudo-GLM (PGLM) in Operations. Chris Siewert 1,2 , Kristin Calhoun 1,3 and Geoffrey Stano 4 1 - OU-CIMMS, 2 - NOAA/NCEP/SPC, 3 - NSSL, 4 - NASA SPoRT GLM Science Meeting 9/20/2012.

E N D
GOES-R Proving GroundStorm Prediction Center and Hazardous Weather Testbed Demonstrating the Pseudo-GLM (PGLM) in Operations Chris Siewert1,2, Kristin Calhoun1,3 and Geoffrey Stano4 1 - OU-CIMMS, 2 - NOAA/NCEP/SPC, 3 - NSSL, 4 - NASA SPoRT GLM Science Meeting 9/20/2012
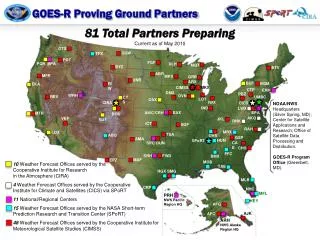
National Weather Center • Storm Prediction Center (SPC) • Hazardous Weather Testbed (HWT) • Norman, OK Weather Forecast Office (OUN) • National Severe Storms Lab (NSSL) • Warning Decision Training Branch (WDTB) • Cooperative Institute for Mesoscale Meteorological Studies (CIMMS) • Center for Analysis and Prediction of Storms (CAPS) • Radar Operations Center (ROC) • OU School of Meteorology • Private Sector
Visiting Scientist Interactions • Dr. Geoffrey Stano (NASA SPoRT) visited SPC March 26-30, 2012 • Provided GLM overview to SPC forecasters and support personnel • Shadowed forecasters on operations floor • Worked to outline delivery and display of PGLM data Dr. Geoffrey Stano providing SPC forecasters and support staff with an overview of the GLM on 27 March 2012.
PGLM at the SPC • Creation and Delivery • Raw source data collected by NASA SPoRT and combined into flashes • Flash extent density created on an 8km national mosaic • Output GEMPAK-friendly format and delivered to SPC via SPoRT LDM • Data arrives every 2 minutes with a 3-4 minute latency • Display • Displayed in IMAGE format within SPC N-AWIPS • Range rings added as VGF overlay • Demonstration • Visiting scientist interactions and SPoRT training module(s) provided for training • 1-on-1 informal demonstrations take place on ops floor when weather permits
NOAA’s Hazardous Weather Testbed Experimental Warning Program Experimental Forecast Program EWP EFP Detection and prediction of hazardous weather events up to several hours in advance Prediction of hazardous weather events from a few hours to a week in advance GOES-R PG
HWT 2012: By the numbers… • 6-week period (7 May – 15 June) • 28 NWS forecasters • WFOs and CWSUs • 18 visiting scientists • CIMSS, CIRA, SPoRT, UAH, DWD, and AFWA • 225 blog posts • Majority from NWS forecasters • 109 completed surveys • 5 weekly “Tales from the Testbed” webinars • Up to 56 WFOs participated weekly
HWT 2012 Changes • AWIPS II • Demonstrate experimental products in AWIPS II for the first time within the HWT in real-time • Many thanks to Darrel Kingfield (OU-CIMMS / NSSL) • WES case and training material • Forecaster participants receive prior to arrival • Forecasters take one admin shift to review material • No death by PowerPoint on Mondays • “Tales from the Testbed” weekly webinars • Based on dual-pol “Storm of the Month” webinars hosted by WDTB • Forecaster participants share their experiences with their peers • Provides opportunity to reach wide audience
PGLM in WES • May 24, 2011 case • Tornadic supercells in OK • Allows forecaster hands-on experience • Immediately following training module • AWIPS I virtual machine • Can be run on desktop • Supports real-time playback • Contains all standard WFO data • Experimental radar data included • Can compare PGLM total lightning to MESH, rotation tracks, etc…
HWT 2012 PGLM Feedback • “The lightning data corresponded well to the strength of the updraft (3dvar data) and to the MESH. The IC lightning seemed to precede strengthening updrafts (or was concurrent), which was helpful to determine which storms to focus on.” • “Would be nice to have a readout of the number of strikes (similar to NLDN) or a time series readout to see the lightning jump as storms reach severe criteria.” • “I'd like to see more examples of PGLM-resolution data from real events--I could see this having utility in a lot of different ways, from severe weather detection to lightning safety. QLCS events are particularly challenging in my area of the country.” • “Total lightning data will revolutionize our operations in the aviation community. This will especially help with dry thunderstorms and in areas of reduced radar coverage. My area of responsibility is very large... and I do not have access to every radar in my area.”
Plans for the future • Storm Prediction Center • Work with SPoRT to ingest additional networks (W. TX, Houston, etc…) • Work with SPoRT to generate national center training module • Continue to work with forecasters on operations floor • Fine tune display (colortable, range rings, tracks, etc…) • Participate in new National Center Perspective blog • Hazardous Weather Testbed • Incorporate lightning tracking/trending tools into AWIPS II demonstration • Continue and refine effective training methods • Hopefully get some additional events • Additional • Get buy-in from new Norman WFO forecasters
Thank you for your attention! chris.siewert@noaa.gov GOES-R Proving Ground at the SPC and HWT on the web: http://goesrnatcentperspective.wordpress.com/ (SPC) http://goesrhwt.blogspot.com/ (HWT)