Download

1 / 40
461 likes | 1.19k Views
DNA Microarray. Presented by: Akram Moslehi. High-throughput methods for measuring cellular states. Gene expression levels: RT-PCR, arrays Protein levels, modifications: mass spec Protein locations: fluorescent tagging Metabolite levels: NMR and mass spec Systematic phenotyping.

E N D
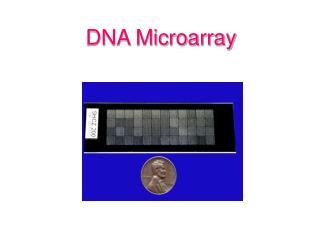
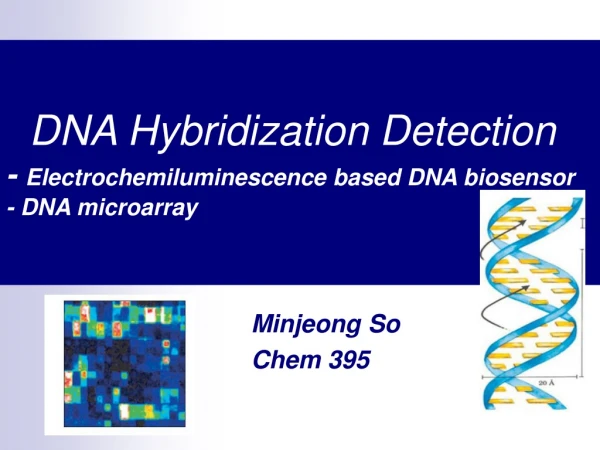
DNA Microarray Presented by: AkramMoslehi
High-throughput methods for measuring cellular states • Gene expression levels: RT-PCR, arrays • Protein levels, modifications: mass spec • Protein locations: fluorescent tagging • Metabolite levels: NMR and mass spec • Systematic phenotyping
Outline of the lectureOverview of Microarray Technology Applications Types of Microarrays Manufacturing Instrumentation and Software Data Analysis-Basic
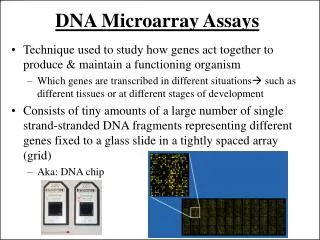
What are Microarrays? • Microarrays are simply small glass or silicon slides upon the surface of which are arrayed thousands of features (usually between 500 up to a million) • Using a conventional hybridization process, the level of expression of genes is measured (for instance) • Microarrays are read using laser-based fluorescence scanners • The process is “high throughput”
Why use Microarrays? • Determine what genes are active in a cell and at what levels • Compare the gene expression profiles of a control vs treated • Determine what genes have increased or decreased in during an experimental condition • Determine which genes have biological significance in a system • Discovery of new genes, pathways, and cellular trafficking
Types of microarrays • Spotted (cDNA) - by Patrick Brown in 1990 • Robotic transfer of cDNA clones or PCR products • Spotting on nylon membranes or glass slides coated with poly-lysine • ink-jet printing (Agilent) • Synthetic (oligo) – by Stephen Fodor in 1991 • Direct oligo synthesis on solid microarray substrate • Uses photolithography (Affymetrix) or ink-jet printing (Agilent) • Labeling can be radioactive, fluorescent (one-color), or two-color
How do we manufacture a spotted microarray?Spotted Glass ArraysUses cDNA, Oligonucleotide, protein, antibody-Robotically spotted cDNAs or Oligonucleotides -Printed on Nylon, Plastic, or Glass microscopeslide Agilent: Oligonucleotide Array
Glass slides characteristics • excellent chemical resistance against solvents, • good mechanical stability (increased thermal strain point) • low intrinsic fluorescence properties.
Start with individual genes Amplify
purity by sequencing or using on agarose gel and an estimate of the DNA concentration This is an important step because all the DNA fragments should be of similar concentration/molarity and size, to achieve similar reaction kinetics for all hybridisations
“Spot” them on a medium, e.g. an ordinary glass microscope slide that chemically modified glass slides usually with poly(L-lysine) or other cross-linking chemical coating materials such as polyethyleneimine polymer p-aminophenyltrimethoxysilane/diazotization the DNA solution will be immobilised on the surface e.g. covalent or non covalent. However in the course of poly (L-lysine) the negatively charged phosphate groups in the DNA molecule, form an ionic bond with the positively charged amine-derivatised surface
chemically modified slides 384 well source plate Spotted arrays steel spotting pin Spotting is done by a robot such as inkjet printing 1 nanolitre spots 90-120 µm diameter concentration of 100-500 µg/ml
3.6cm2 200-250µm Longer sequence target:500-2000bp
The post-print processing step :drying of the DNA on the slide overnight at room temperature and the use of UV cross-linking to prevent subsequent binding of DNA, and to decrease the background signal upon hybridisation of a labelled target
Cartridge-based Chips -Miniaturized, high density arrays of DNA oligos within a plastic housing-One sample=One chip (Affymetrix, Agilent, Applied Biosystems…)-Uses single fluorescent dye-More expensive-Usually 20–25 bases in length-10–20 different oligonucleotides for each gene
GeneChip Technology Affymetrix Inc • Miniaturized, high density arrays of 1,300,000 DNA oligos1-cm by 1-cm • Manufacturing Process: • Solid phase chemical synthesis and Photolithographic fabrication techniques employed in semiconductor industry • Oligonucleotides for each gene selected by computer program to be the following:Unique in genomeNonoverlapping
Spotted Vs. Oligonucleotide array Spotted Arrays • Relative cheap to make (~$10 slide) • Flexible - spot anything you want (2Kbp) • Cheap so can repeat experiments many times • Highly variable spot deposition • Usually have to make your own • Cross hybridisation Affy Gene Chips • Expensive ($500 or more) • Limited types avail, no chance of specialized chips • Fewer repeated experiments usually • Increases specificity, Decrease sensitivity • Can buy off the shelf
Sample preparation and labelling (2)converted into (cDNA) (1) isolating a total RNA containing m RNA (3)labelled with Cy3 , Cy5 (4)purified to remove contaminants such as primers, unincorporated nucleotides, cellular proteins, lipids, and carbohydrates filter spin columns :Qiaquick
Sample preparation and labelling • the sample preparation starts by isolating a total RNA containing messenger RNA that ideally represents a quantitative copy of genes expressed at the time of sample collection (experimental sample & reference sample). • separately converted into complementary DNA (cDNA) • each cDNA (Sample and Control) are labelled with a different tracking molecule, often fluorescent cyanine dyes (i.e. Cy3 and Cy5)
Array hybridisation • the labelledcDNA (Sample and Control) are mixed together • purified to remove contaminants such as primers, unincorporated nucleotides, cellular proteins, lipids, and carbohydrates. Purification is usually carried out using filter spin columns such as Qiaquick from Qiagen • the mixed labelledcDNA is competitively hybridised against denatured PCR product or cDNA molecules spotted on a glass slide
(6)The slides are washed after hybridisation, first to remove any labelledcDNA that did not hybridise on the array, and secondly to increase stringency of the experiment to reduce cross hybridisation. The later is achieved by either increasing the temperature or lowering the ionic strength of the buffers. (5) Before hybridisation, the microarray slides are incubated at high temperature with solutions of saline-sodium buffer (SSC), Sodium Dodecyl Sulfate (SDS) and bovine serum albumin (BSA) to reduce background due to nonspecific binding.
Expression profiling with cDNA microarrays cDNA “B” Cy3 labeled cDNA “A” Cy5 labeled Laser 1 Laser 2 Scanning Hybridization + Analysis Image Capture
cDNA “treament” Cy5 labeled cDNA “control” Cy3 labeled 1 6 1 3 2 3 2 2 2 2 2 5 5 5 5 5 4 3 5 2 3 3 3 6 2 6 4 6 6 6 6 6 6 6 6 5 5 5 5 5 5 Relative intensity 5 5 5 5 Relative intensity Output Output 1 1 6 Expression profiling with DNA microarrays Data acquistion HYBRIDIZATION Spot #1 Spot #4 Spot #2 Spot #5 Spot #3 Spot #6
Reading an array (cont.) Campbell & Heyer, 2003
Cy5 Cy3 Cy5 Cy3 log2 Cy3 Cy5 8 4 2 fold 2 4 8 Underexpressed Overexpressed Experiments Genes Image Analysis & Data Visualization
Normal vs. Normal Normal vs. Tumor All configurations assume the DNA on the array is in excess of the hybridized sample, thus the kinetics are linear and the spot intensity reflects that amount of hybridized sample.
Validating Microarray Expression Data Microarray data are not stand alone results and requires validation by second method Microarray data is only semi-quantitative because of a limited dynamic range. True quantitative results must be determined with another technique such as Quantitative real-time PCR
Microarray Validation Two types of validation 1] Validating the instrument data using the same RNA (confirming a result) And most importantly 2] Validating the biological phenomenon with new samples same experiment conditions Methods Northern Blots, Immunohistochemistry, Western Blot, PCR- i.e.Quantitative real-time PCR **DNA mapping Arrays or CGH may also help indicate where or why a change is occuring
Microarray Future Diagnostics -[Affy, Nanogeneonly at this time] • Disease detection • Tumor classification • Patient stratification • Intervention therapeutics Treatment and Customized Medicine • Clinical arrays currently available are the AmpliChip CYP450 by Affymetrix and Roche. Used for predictive phenotyping in defects of the cytochrome P450 Genes
برگ در انتهای زوال می افتد و میوه در انتهای کمال پس بنگر چگونه میافتی چون برگی زرد و یا چون سیبی سرخ