Download
1 / 29
320 likes | 517 Views
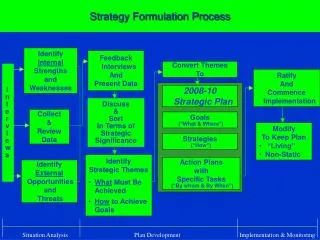
Solid-State NMR Utility in API and Formulation Process Development. Robert Wenslow VP Business Development Crystal Pharmatech www.crystalpharmatech.com. Areas of Application. Analytical. Organic Process. Engineering. Biopharmaceutics. Phys/Chem Stability. Spec. Justification.

E N D
Solid-State NMR Utility in API and Formulation Process Development Robert Wenslow VP Business Development Crystal Pharmatech www.crystalpharmatech.com
Areas of Application Analytical Organic Process Engineering Biopharmaceutics Phys/Chem Stability Spec. Justification Bulk API Characterization In Formulation Samples Produce Stable, Single Phase Bulk Milling Issues Compaction Solvent Stystem Processing Conditions Granulation In vivo performance Excipient Interactions Tableting
Challenging Pharmaceutical Issues • Salt Disproportionation • Polymorphs • Solvates and Hydrates • Amorphous dispersions • Motivation is regulation
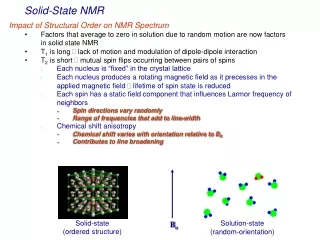
Solid-State NMR Molecular Tumbling Orientation leads to CS difference Rigid Solid http://www.dur.ac.uk/resources/SSNMR/Training_course_PH.pdf
D µ 1/r6 1H 13C Cross-Polarization (CP/MAS) Contact Time Decouple (90) 1H Detect 13C Signal Intensity Signal Buildup through dipole coupling (D) Contact Time J. Chem. Phys. 1973, 59, 569
Structure: Disproportionantion ** K-salt disproportionates in water to the free acid 19F NMR was used to determine the kinetics Fast experiments, quantitative information Can also probe in formulation
Structure: Salt Formation 4 3 Lower decoupling obscures N’s connected to H Disappearance of 2 peak predicted Salt forms at 3 Nitrogen Contact time can also be used to discriminate Useful information but long measuring times
Polymorph Quantitation 19F relaxation curves for I and II 19F NMR spectra of I and II At 8.5 seconds FII shows zero signal 19F relaxometry can be used
Solvate Identification * Peaks from EtOH CP discriminates against the more mobile regions DP discriminates against the more rigid regions Spectral editing combination is powerful to study solvates Form II DP/MAS Form II CP/MAS Split –CH3 indicates multiple environments Straight forward measurements High information content
API in Drug Product L454 Freebase 19F SSNMR was used, measurements done at 5 oC Formulation: API + PEG 600 At 40 mgs/mL API completely dissolved At 80 and 100 mgs/mL shoulder observed
API in Drug Product Expanded spectrum Shoulder at 80 and 100 mgs/mL due to crystalline freebase. Rapid measurements, quantitative estimation of solubility possible.
Amorphous API 1H NMR was used Rigid: Gaussian Mobile: Lorentzian Fitting provides quantitation Amorphous content 22.5% Extremely rapid measurements, quantitative No chemical shift resolution
Amorphous API 31P NMR Amorphous has a very short T1 ~ 250 ms Crystal had a very long T1 ~ 25 sec Material stuck on pins ~ 12 wt% amorphous 10X compaction at 200 MPa (RT) ~ 5 wt% 10X compaction at 200 MPa (85 oC) ~ 2 wt%
Amorphous API Time = 0 2 weeks ambient 2 weeks 25C/60%RH 2 weeks 40C/75%RH -90 -100 -110 -120 -130 Broadening due to defects or phase separated amorphous??
Amorphous API Pure Crystalline T1 = 5 seconds Pure Amorphous T1 = 1 second -90 -100 -110 -120 -130 M(tau)/M0= 1-2*exp(-tau/T1) Each Phase in multi-phase system will yield unique T1 value
Amorphous API End of Drying Sample (MAS) T1 Filter 2.55 sec -90 -100 -110 -120 -130 Monitoring in-process samples Can detect amorphous content without any apriori knowledge of system. Was also used identify presence of multiple crystalline phases
Amorphous API Time = 0 2 weeks ambient 2 weeks 25C/60%RH 2 weeks 40C/75%RH -90 -100 -110 -120 -130 Monitoring stability samples • Intensity directly proportional to amorphous content • Qualitative amorphous content readily achieved • LOD exceedingly low (limited only by NMR time) • Quantitation requires calibration curve
1H T1rho DECRA -100 -80 -60 -40 -20 Stability Sample Previous ID of multiple Phases by 1H T1rho Filter 19F CP/MAS Component 2 200msec T1rho 65% of total spectra Component 1 39msec T1rho 35% of total spectra DECRA
Polymorph ID DECRA • API process involves desolvation to get the anhydrous form • Material forms amorphous on compaction • A second phase observed in 19F SSNMR spectra for different batches • Similar XRPD and DSC XRPD 19F CP/MAS Can we quantify second phase
DECRA DECRA F-f -CF3 19F CP/MAS 1H T1r DECRA Component 2 6msec T1rho 20% of total spectra Component 1 20msec T1rho 80% of total spectra
Driving Process Definition DECRA Wet milling in IPAc followed by Drying at 50 oC recommended
My API doesn’t have a 19F DECRA 1H T1r DECRA Through 19F 13C CP/MAS 1H T1r DECRA Component 2 91msec T1rho 22% of total spectra Component 1 193msec T1rho 78% of total spectra
Heteronuclear Dipolar Correlation • 1H-13C, 1H-15N, and 1H-23Na HETCOR spectra for a hydrated API 13C 15N 23Na 1H Correlations indicate atoms near in space (~3 Å) 24 Cryst. Growth & Des., 2006, 6,2333-2354.
Amorphous Dispersions = drug Polymer Polymer Amorphous domains Solid amorphous solution Crystalline domains (large) Polymer Polymer Crystalline domains Crystals observed visually
2D 1H-19F Correlation O O H O H F F O N n • 1H-19F CP-HETCOR easily proves molecular association on the < 10 Å scale • Experiments such as these take 1-2 hours to perform for typical drug loads (20-60% w/w) 500 s Diflunisal PVP Solid amorphous solution 2 ms (spin diffusion) Mol. Pharmaceutics, 7,1667–1691 (2010).
Amorphous Dispersions • A dispersion that greatly improves the dissolution of tenoxicam in water (via a high degree of supersaturation) • Contains four discrete components = tenoxicam (singly ionized) = L-arginine (singly ionized) = L-arginine (zwitterionized) Polyvinylpyrrolidine Solid amorphous solution J. Pharm. Sci.2012,101, 641-663.
Nanocrystallline dispersion Polymer Crystalline Domains ~50 nm Pharm. Res.2012,29, 1866-1881
Concluding Thoughts • Multitude of options to characterize API and drug product material • Relaxation methodology very powerful • Expanding into 2D offers significant structure information