Download
1 / 25
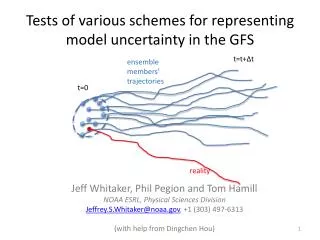
250 likes | 391 Views

E N D
A Stochastic Perturbation Scheme For Representing Model Related UncertaintyDingchen Hou, Zoltan Toth and Yuejian ZhuEnvironmental Modeling Center/NCEP/NOAAAcknowledgements:Mark Iredell, Henry Juang, Stephane Vannitsem,Richard Wobus, Bo Cui, Cecile Penland, Prashant Sardeshmukh,Weiyu Yang, James Purser and Mozheng Wei18th Conference on Probability and Statistics in the Atmospheric Sciences29 January – 2 February, 2006, Atlanta, Georgia
Representing Model Related UncertaintyA Proposed Stochastic Perturbation Scheme General Approach: Adding a stochastic forcing term in to the tendencies of the model equations. Assumption: The perturbations (difference between ensemble members and the control) in the conventional tendencies provide a sample of realizations of the additional stochastic forcing S. Strategy: Generate the S terms from (random) linear combinations of the conventional perturbation tendencies. Desired Properties 1. Forcing applied to all variables 2. Approximately balanced 3. Smooth variation in space and time 4. Flow dependent 5. Quasi-orthogonal Expected Results Increased spread Reduced systematic error Improved probabilistic forecast
Outliers: H500, day 6 forecast, 20041002 Without SP large number of outliers with negative and positive forecast bias With SP the number of outliers is significantly reduced
Statistics: Ensemble Spread and Error of Ensemble MeanIncreased Spread, Reduced Mean Error (ME)Reduced Mean Absolute Systematic Error (MASE)----- Without SP ------- With SP Solid, rmse Dash: spread Solid: rmse Dash: spread MASE Mean Error Mean Error
Comparison with Post-Processing (PP) RPSS: Improved in both cases (SP and PP)SP is more effective in week 2 forecast Stochastic Parameterization (SP) Bias-correction (1%PP) ---- Without SP ---- With SP ---- Without SP but optimal pp (upper limit) ---- Operation ---- Operation +1%PP ---- Operation + optimal pp (upper limit)
Combination of SP and PPInsert the 2004 October experiments forecast into operational data setsto apply the adaptive algorithm of Bias Correction (PP)For RPSS Score, the positive impact of SP and PP adds up, leading to improvement for all lead times and at greater extend !Performance of SP+PP is highest although the procedure may underestimate its score due to over-correction rms ---OPT ---SP ---OPT+PP ---SP+PP --- Without SP --- With SP --- Without SP after PP --- With SP after PP Spread RPSS ME
Why do we need ensemble forecasting To represent forecast uncertainty. Sources of Forecast Uncertainty INITIAL CONDITIONS MODEL Approaches to Representing Model Related Uncertainties a) Multiple Model To describe systematic errors. No truncation related error included. Multi-version of a single model (e.g.Houtekamer et al. 1996; Stensrud et al. 2000; Hou et al. 2004; Du, 2004) Multi-model, Multi-version (e.g.MSC global ensemble; Du and Tracton 2001) Multi-model, Multi-center (e.g.Richardson, 2001; THORPEX NAEFS, Toth et al, 2006) b) Stochastic Parameterization To describe truncation related errors --- effects of subgrid scale procedures ECMWF (Buizza et al. 1999) Shutts, 2004: Stochastic Kinetic Energy Backscatter (SKEB). Teixeira et al., 2006: Stochastic convection parameterization. Mylne et al, 2005: Stochastic Convective Vorticity (SCV) and Random Parameters (RP). Toth and Kalnay, 1995 Perez-Munuzuri et al, 2003: S ~ State perturbations Introduction
Formulation ofthe Proposed Stochastic Perturbation Scheme General Framework: ∙ Xi = Ti + Si i=1,2,…,N for N members; 0 for control Desired Properties of the Stochastic Forcing Terms S 1. Forcing applied to all variables 2. Approximately balanced 3. Smooth variation in space and time 4. Flow dependent 5. Quasi-orthogonal Assumption: The ensemble perturbations in the conventional tendencies provide a sample of realizations of the stochastic forcing S. P vectors are quasi orthogonal; vary smoothly in space and time; can be used as the basis of S.
Formulation ofthe Proposed Stochastic Perturbation Scheme Strategy:Use P vectors as the basis for stochastic forcing S Generate the S terms from (random) linear combinations of the conventional perturbation tendencies, i.e. Generalization of the Toth and Kalnay (1995) method Similar to ET but applied to ensemble perturbation tendencies successively • Matrix Notation (N forecasts at M points) • S (t) = P(t) W(t) • MxN MxN NxN • As P is quasi orthogonal, an orthonormal matrix W ensures orthogonality for S. • Generation of W matrix: • a) Start with a random but orthonormalized matrix W(t=0); • b) Random Walk in N-Dimesion space to get W(t)=W(t-1) R(t). R represents random but slight rotation in N-D space • (suggested by James Purser).
Formulation ofA simplified version 1. Use a single perturbation tendency instead of a combination Random match between i and j . Xi 2. Use finite difference form for the stochastic term . For t=k*6hr, where k=1,2,3,… and Xi . otherwise Xi = Ti • 3. Coefficients a’s ------ simplified W matrix • Sign: + or -, randomly selected for each i, unchanged with time. • Magnitude: flow dependent, to re-scale the perturbations to a representative size in NH, SH and TR, using 500hPa KE as norm.
Vorticity Increment Example of the Stochastic Forcing 500hPa vorticity increment and corresponding total kinetic energy increment at 18h of forecast, initialized 00Z, Sep. 25, 2004. 500 hPa height, 00Z,09/26/2004 Kinetic Energy Increment
Outliers: H500, day 6 forecast, 20041002 Without SP large number of outliers with negative and positive forecast bias With SP the number of outliers is significantly reduced
Statistics: Percentage Excessive Outliers, reduced by SP Forecast consistency: improved by SP
Comparison with Post-Processing (Cui,Toth and Zhu,2005)Stochastic Parameterization (SP) Bias-Correction (PP)In MASE reduction, SP is effective in week 2 ---- Without PP ---- With 1%PP rms ---- Without SP ---- With SP rms Spread Spread MASE MASE ME ME
Statistics: Ensemble Spread and Error of Ensemble MeanIncreased Spread, Reduced Mean Error (ME)Reduced Mean Absolute Systematic Error (MASE)----- Without SP ------- With SP Solid, rmse Dash: spread Solid: rmse Dash: spread MASE Mean Error Mean Error
Comparison with Post-Processing (PP) RPSS: Improved in both cases (SP and PP)SP is more effective in week 2 forecast Stochastic Parameterization (SP) Bias-correction (1%PP) ---- Without SP ---- With SP ---- Without SP but optimal pp (upper limit) ---- Operation ---- Operation +1%PP ---- Operation + optimal pp (upper limit)
SUMMARY • A stochastic perturbation scheme is proposed and tested for NCEP Global Ensemble Forecast System with a simplified version. The structured stochastic forcing terms are based on the differences in tendencies between ensemble members and the control run. • The stochastic perturbation added to the model are balanced, flow-dependent and have random noise structure and geographic patterns, changing smoothly in time and space. • By including this stochastic parameterization scheme, the ensemble spread is significantly increased, with fewer outliers. The Mean Error and Mean Absolute Systematic Error (MASE) of the ensemble mean forecast is also significantly reduced. For probabilistic forecasts, the scheme can significantly improve performance scores. The scheme is more effective in week 2 forecast compared with week 1 forecast. • Combining the stochastic parameterization scheme with a post processing procedure (adaptive Bias-Correction) will further improve the forecast, leading to significant improvement at all lead times. This suggests that the stochastic parameterization scheme really make difference!
ONGOING RESEARCH • Modify scripts and code to test the scheme without simplifications. • Conduct experiments to test the scheme for longer period and various seasons. • Verify the forecast output for more variables and verification scores. • Develop software capacity to synchronize the integration of the ensemble members and control run (ESMF project, Weiyu Yang) so that the scheme can be implemented for operation.
Existing Stochastic Perturbation Schemes General Framework X is a model variable; T is the conventional tendency; S is the stochastic tendency term. . Model equation, conventional form: X = T . Model equation, stochastic parameterization X= T+ S . i=1,2,…,N for N members; 0 for control For Ensemble Forecast: Xi = Ti + Si • How to Formulate the S? • S is explicitly related to a component of T, multiplied by a random number h. • 1.ECMWF (Buizza et al. 1999) : S ~ parameterized component of T. h is specified with temporal/spatial correlation. Spatially/temporally discontinuity possible. • Shutts, 2004: Stochastic Kinetic Energy Backscatter (SKEB). S ~ KE dissipation rate. h is from a cellular automation. Only for stream function. unbalanced. • Teixeira et al., 2006: Stochastic convection parameterization. S ~ convection tendency. Imbalance and discontinuity possible. • S is implicitly related to T: • 4. Mylne et al, 2005: Stochastic Convective Vorticity (SCV) and Random Parameters (RP). S is implicitly related to the CAPE or physics parameterization parameters. • 5. Toth and Kalnay, 1995 and Perez-Munuzuri et al, 2003: S ~ State perturbations
Formulation ofthe Proposed Stochastic Perturbation SchemeDetermination of Combination coefficients • Initialize W: W(t=0) • An orthonormal matrix W (an orthonormal basis in N-Dimensional space) of dimension NxN, can be generated by independently sampling random numbers (from a gauss distribution) and then applying the Gramm-Schmidt procedure. • 2) Rotate W: W(t) = W(t-1) R(t) • Random linear transformation is used to make the matrix W a function of time. R(t) is an orthonormal matrix with its diagonal elements close to 1 and others small, generated by applying the Gram-Schmidt procedure to a random anti-symmetric matrix. W(t) remains orthonormal. (suggested by J. Purser) Plotted are time series of the combination coefficients w(i,j), j=1,2,…,10, for i=1. .
Comparison with Post-Processing (PP): BSSSP increases BSS by reducing its reliability componentStochastic Parameterization (SP) Bias-Correction (PP) BSS BSS ---- Without SP ---- With SP ---- Without SP but optimal pp ---- Operation ---- Operation +1%PP ---- Operation + optimal pp Reliability Reliability Resolution Resolution
Understanding the Impact of the SP scheme on the System Palmer, 2003 Mean state with noise Mean state without noise • Benefits of Stochastic parameterization Expected (Palmer, 2003) and • Realized with the current scheme • More Complete representation of model uncertainty • Increase spread • Reduction in model systematic error (noise-induced drift) • Significant reduction in ME and MASE • Improvement in Probabilistic forecast scores • More Accurate estimate of internal climate variability • More improvement in week 2 than in week 1?
Ensemble Mean Forecast and SpreadComparison between flow-dependent and flow-independent SPFlow-independent SP is generated in Sep.25 run but used in Oct. fsct.With flow-independent SP, SPREAD increase and error reduction are less effective