Download
1 / 50
500 likes | 653 Views
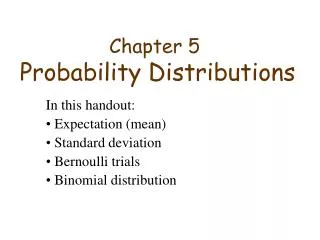
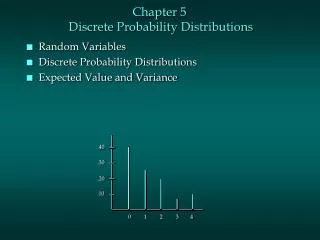
CHAPTER 5 Probability Distributions. Outline. 5-1 Introduction 5-2 Probability Distributions 5-3 Mean, Variance, and Expectation 5-4 The Binomial Distribution. Objectives. Construct a probability distribution for a random variable.

E N D
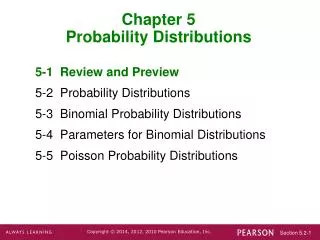
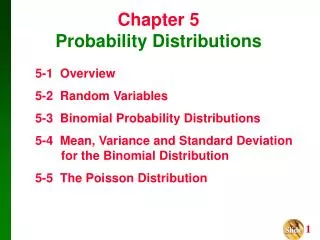
Outline • 5-1 Introduction • 5-2 Probability Distributions • 5-3 Mean, Variance, and Expectation • 5-4 The Binomial Distribution
Objectives • Construct a probability distribution for a random variable. • Find the mean, variance, and expected value for a discrete random variable. • Find the exact probability for X successes in n trials of a binomial experiment.
Objectives • Find the mean, variance, and standard deviation for the variable of a binomial distribution.
5-2 Probability Distributions • A variableis defined as a characteristic or attribute that can assume different values. • A variable whose values are determined by chance is called a random variable.
5-2 Probability Distributions Variable Discrete Assume only a specific number of values. Values can be counted. Continuous Assume all values in the interval between two given values. Values can be measured.
5-2 Probability Distributions Examples of Discrete Variables Number of calls Outcomes for die rolling
5-2 Probability Distributions Examples of Continuous Variables Temperature Time
5-2 Probability Distributions • Adiscrete probability distribution consists of the values a random variable can assume and the corresponding probabilities of the values. • The probabilities are determined theoreticallyor by observation.
5-2 Probability Distributions First Toss Second Toss H Tossing Two Coins H T H T T
5-2 Probability Distributions • From the three diagram, the sample space will be represented byHH, HT, TH, andTT. • If X is the random variable for the number of heads, then X assumes the value 0, 1, or 2.
5-2 Probability Distributions Sample Space Number of Heads TT TH HT HH 0 1 2
5-2 Probability Distributions Experiment: Toss Two Coins 1 Y T I L I 0 . 5 B A B O R P 0.25 0 1 2 N U M B E R O F H E A D S
5-3 Mean, Variance, and Expectation for Discrete Variable • The mean of the random variable of a probability distribution is where X1 , X2 , …, Xn are outcomes and P(X1), P(X2), …, P(Xn) are the corresponding probabilities. µ = X1 • P(X1) + X2 • P(X2) + … + Xn • P(Xn) = X• P(X)
5-3 Mean for Discrete Variable Example 1 • Find the mean of the number of spots that appear when a die is tossed. The probability distribution is given below.
5-3 Mean for Discrete Variable µ =X• P(X) =1•(1/6) + 2•(1/6) + 3•(1/6) + 4•(1/6) + 5•(1/6) + 6•(1/6) = 21/6 = 3.5 The theoretical mean is 3.5.
5-3 Mean for Discrete Variable Example 2 • In a family with two children, find the mean number of children who will be girls. The probability distribution is given below.
5-3 Mean for Discrete Variable µ =X• P(X) =0•(1/4) + 1•(1/2) + 2•(1/4) = 1 The average number of girls in a two-child family is 1.
5-3 Variance for Discrete Variable • The varianceof a probability distribution is found by multiplying the square of each outcome by its corresponding probability, summing these products, and subtracting the square of the mean.
5-3 Variance for Discrete Variable The variance of a probability distribution The standard deviation of a probability distribution
5-3 Variance for Discrete Variable Example • Five balls numbered 0, 2, 4, 6, and 8 are placed in a bag. After the balls are mixed, one is selected, its number is noted, and then it is replaced. If the experiment is repeated many times, find the variance and standard deviation of the numbers on the balls.
5-3 Variance for Discrete Variable = (0)(1/5) + (2)(1/5) + (4)(1/5) + (6)(1/5) + (8)(1/5) = 4.0 X 2P(X)= (02)(1/5) + (22)(1/5) + (42)(1/5) + (62)(1/5) + (82)(1/5) = 0 + 4/5 + 16/5 + 36/15 + 64/5 = 120/5 = 24
Question The probability distribution for the number of customers one day at the Sunrise Coffee Shop is shown as below. Find the mean, variance, and standard deviation of the distribution.
5-3 Expectation • The expected values of a discrete random variable of a probability distribution is the theoretical average of the variable. The symbol of E(X) is represented expected value. µ = E(X) = X• P(X)
5-3 Expectation Example 1 One thousand tickets are sold at RM 1 each for four prizes of RM100, RM50, RM25, and RM10. What is the expected value of the gain if a person purchases one ticket?
5-3 Expectation E(X) = X• P(X) = RM99 • 1/1000 + RM49 • 1/1000 + RM24 • 1/1000 + RM9 • 1/1000 + (-RM1) • 996/1000 = -RM0.815
5-3 Expectation Example 2 A lottery offers one RM1000 prize, one RM500 prize, and five RM100 prizes. One thousand tickets are sold at RM3 each. Find the expectation of the gain if a person purchases one ticket?
5-3 Expectation E(X) = X• P(X) = RM997 • 1/1000 + RM497 • 1/1000 + RM97 • 5/1000 + (-RM3) • 993/1000 = -RM1
5-4 The Binomial Distribution Binomial experiment is a probability experiment that satisfies the followingfourrequirements: 1. Each trial can have only twooutcomes or outcomes that can be reduced to two outcomes. These outcomes can be considered as either successorfailure. 2. There must be fixednumber of trials.
5-4 The Binomial Distribution 3. The outcomes of each trial must be independentof each other. 4. The probability of a success must remain the samefor each trial.
5-4 The Binomial Distribution • The outcomes of a binomial experiment and the corresponding probabilities of these outcomes are called asbinomial distribution.
5-4 The Binomial Distribution Notation for the Binomial Distribution P(S) = p, probability of success P(F) = 1 - p = q, probability of failure n = number of trials X = number of successes
5-4 Binomial Probability Formula • In a binomial experiment, the probability of exactly X successes in n trials is n ! P ( X ) p q X n X ( n X ) ! X !
5-4 Binomial Probability Example 1 • If a student randomly guesses at five multiple-choice questions, find the probability that the student gets exactly three correct. Each question has five possible choices.
5-4 Binomial Probability Solution n = 5, X = 3, and p = 1/5. Then, P(3) = [5!/(5-3)!3!] (1/5)3 (4/5)2 = 0.0512 ≈ 0.05
5-4 Binomial Probability Example 2 • A survey from Teenage Research Unlimited found that 30% of teenage consumers received their spending money from part-time jobs. If five teenagers are selected at random, find the probability that at least three of them will have part-time jobs.
5-4 Binomial Probability Solution n = 5, X = 3, 4, 5 and p = 0.3. Then, P(X≥3) = P(3) + P(4) + P(5) = 0.132 + 0.028 + 0.002 = 0.162
5-4 Binomial Probability P(4) = [5!/(5-4)!4!] (0.3)4 (0.7)1 = 0.028 P(5) = [5!/(5-5)!5!] (0.3)5 (0.7)0 = 0.002 P(3) = [5!/(5-3)!3!] (0.3)3 (0.7)2 = 0.132
5-4 Binomial Probability Example 3 • Public Opinion reported that 5% of Malaysians are afraid of being alone in a house at night. If a random sample of 20 Malaysians is selected, find the probability that exactly 5 people in the sample who are afraid of being alone at night.
5-4 Binomial Probability Solution n = 20, p = 0.05, X = 5 By using formula, P(5) = [20!/(20-5)!5!] (0.05)5 (0.95)15 = 0.002
5-4 Binomial Probability From the table, P(5) = 0.002
QUESTION If 90% of all people between the ages of 30 and 50 drive a car, find these probabilities for a sample of 20 people in that age group. a) Exactly 20 drive a car. b) At least 17 drive a car. c) At most 18 drive a car.
5-4 Mean, Variance, Standard Deviation for the Binomial Distribution Mean µ = n • p Variance= n • p • q Standard deviation = n • p • q
5-4 Mean, Variance, Standard Deviation for the Binomial Distribution Example • A coin is tossed four times. Find the mean, variance, and standard deviation of the number of heads that will be obtained.
5-4 Mean, Variance, Standard Deviation for the Binomial Distribution Solution: n = 4, p = 1/2, q = 1/2 µ = n • p = (4)(1/2) = 2 Variance = n • p • q = (4)(1/2)(1/2) = 1 Standard deviation = n • p • q =1 = 1
QUESTION If 80% of the applicants are able to pass a driver’s proficiency road test, find the mean, variance, and standard deviation of the number of people who pass the test in a sample of 300 applicants.