Download
1 / 60
600 likes | 794 Views
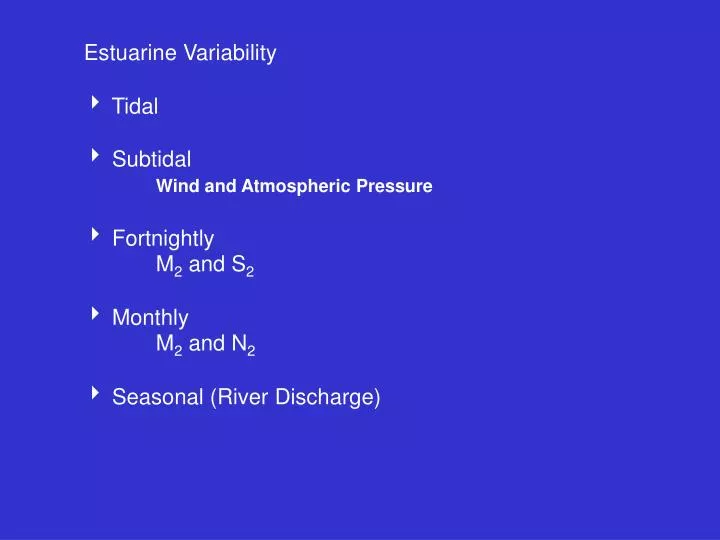
Estuarine Variability Tidal Subtidal Wind and Atmospheric Pressure Fortnightly M 2 and S 2 Monthly M 2 and N 2 Seasonal (River Discharge). Estuarine Variability Tidal Subtidal Wind and Atmospheric Pressure Fortnightly M 2 and S 2 Monthly

E N D
Estuarine Variability Tidal Subtidal Wind and Atmospheric Pressure Fortnightly M2 and S2 Monthly M2 and N2 Seasonal (River Discharge)
Estuarine Variability Tidal Subtidal Wind and Atmospheric Pressure Fortnightly M2 and S2 Monthly M2 and N2 Seasonal (River Discharge)
Tidal Straining Slack Before Ebb Ocean River Tidal Flow Ocean Ebb
End of Ebb Tidal Flow Flood Animation of Shear Instability
Example of Tidal interaction with density gradient Chilean Inland Sea Pitipalena Estuary
CTD Time Series 1 2
1 2
z1 To mix the water column, kinetic energy has to be converted to potential energy. Mixing increases the potential energy of the water column z2 z
Potential energy of the water column: Potential energy per unit volume: But The potential energy per unit volume of a mixed water column is: Ψ has units ofenergy per unit volume
z1 z2 If z no energy is required to mix the water column The energy difference between a mixed and a stratified water column is: with units of [ Joules/m3 ] φ is the energy required to mix the water column completely, i.e., the energy required to bring the profile ρ(z) to ρhat It is called the POTENTIAL ENERGY ANOMALY It is a proxy for stratification The greater the φ the more stratified the water column
But the changes of stratification per unit time are given by: Integrating with depth, the depth-integrated density equation is: are deviations from depth-mean values Plugging Simpson et al. (1990, Estuaries, 13, 125) 1st and 2nd terms on RHS are shear dispersion 3rd term is density flux at the surface 4th term is density flux at the bottom 5th term is depth-integrated source/sink term
De Boer et al (2008, Ocean Modeling, 22, 1) Bx and By are the along-estuary and cross-estuary straining terms Ax and Ay are the advection terms Cx and Cy interaction of density and flow deviations in the vertical C’x and C’y correlation between vertical shear and density variations in the vertical; depth-averaged counterparts of C E is vertical mixing and D is vertical advection Hx and Hy are horizontal dispersion; Fs and Fb are surface and bottom density fluxes
Sketch of changes in stratification by the main mechanisms Burchard and Hofmeister (2008, ECSS, 77, 679)
1-D idealized numerical simulation of tidal straining Burchard and Hofmeister (2008, ECSS, 77, 679)
destratified @ end of flood stratified entire period Burchard and Hofmeister (2008, ECSS, 77, 679)
is: The mean over a tidal cycle of because The tidal stress is independent of z as is the barotropic pressure gradient. 0 e.g. Another dynamical implication of tidal flows is the generation of a mean non-linear term: Tidal stresses tend to operate with the barotropic pressure gradient.
Estuarine Variability Tidal Subtidal Wind and Atmospheric Pressure Fortnightly M2 and S2 Monthly M2 and N2 Seasonal (River Discharge)
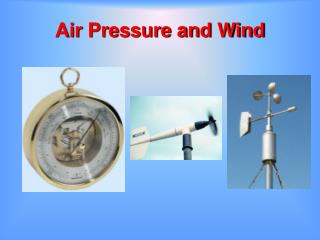
Wind forcing may: produce mixing induce circulation generate surface slopes But at the air-water interface it is: Subtidal Variability Produced by direct forcing on estuary (local forcing) or on the coastal ocean, which in turn influences estuary (remote forcing - coastal waves) Wind-produced mixing The energy per unit area per unit time or power per unit area generated by the wind to mix the water column is proportional to W3 At a height of 10 m, the power per unit area generated by the wind stress is: The wind power at the air water interface is only 0.1 % of the wind power at a height of 10 m.
s s Weak Depth-Averaged Transport Large Depth-Mean Transport Acts from the surface downward May destratify the entire water column when forcing is large and buoyancy is low Wind-induced circulation The wind-induced circulation can compete with estuarine circulation, or act in concert The wind-induced circulation will depend on stratification: depth-dependent under stratified conditions weak depth-dependence under homogeneous conditions
Mean Momentum Balance? In a Fjord?
x1 sx x2 y x1 x2 x Wind-Induced Surface Slope Can be assessed from the vertical integration of the linearized u momentum equation, with no rotation @ steady state: Note that a westward sx (negative) produces a negative slope. Wind will pile up water in the direction toward which it blows.
The perturbation produced by the wind propagates into the estuary and may cause seiching if the period of the perturbation is close to the natural period of oscillation:
Forcing from Atmospheric Pressure Gradients Another mechanism that may cause subtidal variability in estuaries comes from atmospheric or barometric pressure. Low High mouth Low head High head mouth depth z Indirectly through sea level slope x
Another mechanism that may cause subtidal variability in estuaries comes from atmospheric or barometric pressure.
Hurricane Felix Δη = -ΔP/(ρg) ΔP of 1 mb (100 Pa) = Δη of 0.01 m
Wind Response to Felix
Estuarine Variability Tidal Subtidal Wind and Atmospheric Pressure Fortnightly M2 and S2 Monthly M2 and N2 Seasonal (River Discharge)
Depth Mean or Residual Flow Can you see this modulation from the analytical solution? Ocean Neap Spring Mean or Residual Salinity (Density) Depth Increasing salinity
Estuarine Variability Tidal Subtidal Wind and Atmospheric Pressure Fortnightly M2 and S2 Monthly M2 and N2 Seasonal (River Discharge)
N C N C C N
(Journal of Physical Oceanography, 2007, 2133) Salt Intrusion vs. River Discharge Model
6 5 4 3 2 1 Strong outflow from both River Discharge and NW winds 2 / 3 of volume outflow associated with river input 1 / 3 to wind forcing
Nearly 50 km from the ocean – Wilcox station Mean Discharge in past 20 years: 200 m3/s 60 Suwannees = 1 Mississippi
Wilcox; 50 km upstream Flood Stage Height (m) Discharge (m3/s)
seaward W landward
Axial Distributions of Salinity H M H Spring 1999 H M M Fall 1999