Download
1 / 72
720 likes | 1.36k Views
Meteo 1020 – Lecture 4 The Natural Variability of the Earth-Atmosphere System. Natural variability can be classified by its forcing type (internal or external to the climate system) and whether it is periodic/cyclic or episodic. Modes of Natural Variability that we know of:

E N D
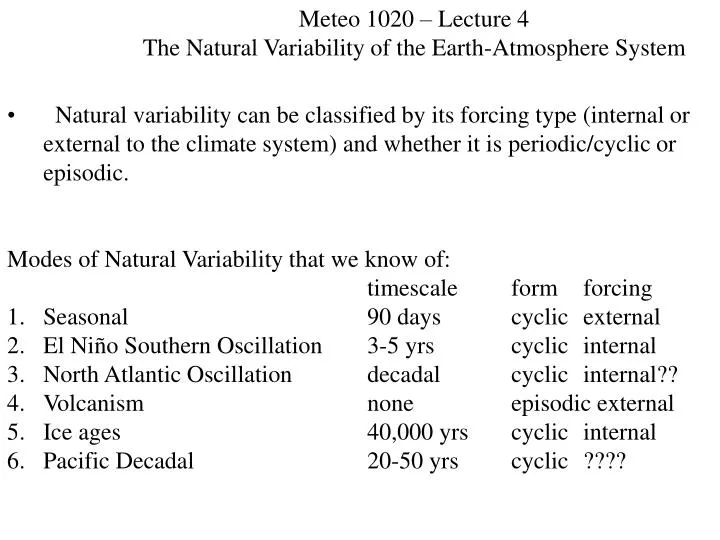
Meteo 1020 – Lecture 4 The Natural Variability of the Earth-Atmosphere System • Natural variability can be classified by its forcing type (internal or external to the climate system) and whether it is periodic/cyclic or episodic. • Modes of Natural Variability that we know of: • timescale form forcing • Seasonal 90 days cyclic external • El Niño Southern Oscillation 3-5 yrs cyclic internal • North Atlantic Oscillation decadal cyclic internal?? • Volcanism none episodic external • Ice ages 40,000 yrs cyclic internal • Pacific Decadal 20-50 yrs cyclic ????
Meteo 1020 – Lecture 4 The Natural Variability of the Earth-Atmosphere System • Air-Sea Interactions: • Ocean and atmosphere communicate with one another: • constituents: water (precipitation and evaporation), carbon dioxide, oxygen, trace gasses, etc • Energy – momentum through wind stress driving the surface currents • Heat – sensible heat and latent heat due to evaporation http://science.hq.nasa.gov/oceans/images/water_cycle.jpg
Ocean structure: on average: warm and relatively fresh mixed layer lying on top of a nearly isothermal (same temperature) cold and salty water mass http://www.wbgu.de/Images/sn_2006_en/2.1-4.png
How does ocean circulation affect local climates? Answer: Heat release locations are warmer! Warm surface current- Less Dense Cold deep water current–More Dense Salty water anywhere- More Dense Intergovernmental Panel on Climate Change (IPCC), "Climate Change 2001: The Scientific Basis"
What directions do warm and cold water currents travel? Animation by Jack Cook (Woods Hole Oceanographic Institute)
Is it true that the North Atlantic current could shut down? The ocean surface transfers heat to the atmosphere! Animation by Jack Cook (Woods Hole Oceanographic Institute)
Meteo 1020 – Lecture 4 The Natural Variability of the Earth-Atmosphere System The global thermohaline circulation: Cold Salty water in the north Atlantic becomes dense and convects downward, spreads southward and contributes to vertical overturning of deep ocean water on millennial timescales. Importance: Climate of northern Europe and Asia rely on heat and moisture supplied to atmosphere to keep climate habitable in extreme northern latitudes.
What process could change the ocean circulation?http://www.whoi.edu/page.do?pid=12455&tid=282&cid=10046go to bookmarks
Is freshwater increasing in the North Atlantic? http://www.whoi.edu/templates/files/multimedia.jsp?pid=12455&cid=7466&cl=6732
http://www.whoi.edu/institutes/occi/images/occi_abrclimate_jk_lev_en.gifhttp://www.whoi.edu/institutes/occi/images/occi_abrclimate_jk_lev_en.gif
Meteo 1020 – Lecture 4 The Natural Variability of the Earth-Atmosphere System Even though the oceans and atmosphere are both fluids, they have a fundamental difference – their density: Atmosphere 1 kg/cubic meter, Ocean – approximately 1000 kg/cubic meter. This density difference leads to large difference in heat capacity. Heat capacity is defined as the amount of temperature change in kelvin degrees for a unit input of heat energy. The ocean’s heat capacity is approximately 41 times that of the atmosphere. A 1 degree change in atmospheric temperature is equivalent to an 0.02 change in ocean temperature change.
Meteo 1020 – Lecture 4 The Natural Variability of the Earth-Atmosphere System El Nino is an example of air-sea interactions that occur on annual time scales Note figures 4.8 and 4.9: Sea surface temperature (SST) patterns change fundamentally with the el nino cycle The atmosphere both forces and responds to the el nino cycle. Normal sst patterns: atmospheric forcing of sst is accomplished through easterly trade winds cooling the central and eastern equatorial pacific. Atmosphere responds to warm western pacific water by the occurrence of strong thunderstorms in that region
http://teacherresourceexchange.org/science/coriolis/index.phphttp://teacherresourceexchange.org/science/coriolis/index.php
ENSO Animation http://www.cpc.noaa.gov/products/precip/CWlink/MJO/enso.shtml#current http://sealevel.jpl.nasa.gov/science/images/el-nino-la-nina.jpg
ENSO Outline Mean state of the ocean and atmosphere across the tropical Pacific Mean ocean surface temperaturesMean tropical Pacific rainfall, winds, and subsurface ocean temperaturesMean wintertime jet streams over the North Pacific and South Pacific The ENSO cycle El Niño and La Niña Ocean Temperature PatternsThe Southern Oscillation and its link to the ENSO cycleThe Southern Oscillation Index (SOI) El Niño El Niño (ENSO) related rainfall patterns over the tropical PacificEl Niño-related winds, the state of the equatorial Walker circulation, subsurface ocean structureEl Niño-related global temperature and rainfall patterns El Niño - related changes in atmospheric circulation in the subtropics and middle latitudes La Niña La Niña-related rainfall patterns over the tropical PacificLa Niña-related winds, the state of the equatorial Walker circulation, subsurface ocean structureLa Niña-related global temperature and rainfall patternsLa Niña- related changes in atmospheric circulation in the subtropics
2. Mean tropical Pacific rainfall, winds, and subsurface ocean temperatures • NOAA Image and text
Summary: Normally in the equatorial pacific Trade winds blow from the east to the west Warm water piles up on the western side of the equatorial pacific ocean Cool water upwells along the coast of South America Low pressure is observed over Indonesia and the western pacific ocean and heavy rainfall occurs there High pressure is observed in the eastern pacific ocean.
El Niño and La Niña Ocean Temperature Patterns • NOAA Image and text
The Southern Oscillation and its link to the ENSO cycle • NOAA Image and text
How are high and low pressures related to rainfall and winds?
Pressure Force More air on the left hand side (higher pressure). The pressure difference over that distance of the sheet (the pressure gradient force), pushes the sheet to the right.
Pressure Force More air on the left hand side (higher pressure). The pressure difference on either side of the parcel (the pressure gradient force), pushes the parcel to the right.
Pressure Gradient Force http://ww2010.atmos.uiuc.edu/(Gh)/guides/mtr/fw/pgf.rxml
If the earth was not spinning, air would move directly from high to low pressure areas. http://teacherresourceexchange.org/science/coriolis/index.php
http://teacherresourceexchange.org/science/coriolis/index.phphttp://teacherresourceexchange.org/science/coriolis/index.php
Coriolis Forcehttp://ww2010.atmos.uiuc.edu/(Gh)/guides/mtr/fw/gifs/coriolis.mpgVideo
El Nino Related Rainfall • NOAA Image and text
2. Mean tropical Pacific rainfall, winds, and subsurface ocean temperatures • NOAA Image and text
El Niño-related winds, the state of the equatorial Walker circulation, subsurface ocean structure • NOAA Image and text
Ocean productivity and El Niño easterly trade winds weaken, allowing warmer waters of the western Pacific to migrate eastward and eventually reach the South American Coast. The cool nutrient-rich sea water normally found along the coast of Peru is replaced by warmer water depleted of nutrients, resulting in a dramatic reduction in marine fish and plant life.
El Niño • NOAA Image and text
La Niña-Related Rainfall Patterns over the Tropical Pacific • NOAA Image and text
2. Mean tropical Pacific rainfall, winds, and subsurface ocean temperatures • NOAA Image and text
La Niña-Related Winds, Walker Circulation, and Subsurface Ocean Temperatures • NOAA Image and text
La Niña-Related Global Temperature and Precipitation Patterns • NOAA Image and text
World Connections of weather patternsshift in the distribution of heat in the atmosphere and ocean which moves things around (Boiling pot) • NOAA Image and text
La Niña Stronger easterly (coming from the east) winds occur moving surface water away from the western coast of South America. La Niña (female child) La Niña occurs roughly half as often as El Niño.
Current Data • NOAA Image and text
Current La Niña • NOAA Image and text
Sea Surface Temperatures • NOAA Image and text
Upper ocean heat changes • NOAA Image and text
Ocean Anomalies • NOAA Image and text
Meteo 1020 – Lecture 4 The Natural Variability of the Earth-Atmosphere System An el nino is characterized by a general warming of the water in the central and eastern pacific. Atmosphere forces the ocean by a weakening of the easterly trades in the central and eastern pacific. Atmosphere responds by shifting thunderstorm activity eastward to the central pacific. Implications: Interruption of fishery along western margins of South America, failure and/or weakening of the Indian Monsoon impacting agriculture in that region.
Meteo 1020 – Lecture 4 The Natural Variability of the Earth-Atmosphere System El nino remote forcing: the modulation of the normal patterns in the equatorial pacific influence weather patterns around the world: In the U.S., the pacific storm track is shifted southward leading resulting in storminess over the southwestern U.S. and droughts over the Pacific Northwest. Precipitation is often reduced over the southeastern U.S.
Meteo 1020 – Lecture 4 The Natural Variability of the Earth-Atmosphere System • Natural variability can be classified by its forcing type (internal or external to the climate system) and whether it is periodic/cyclic or episodic. • Modes of Natural Variability that we know of: • timescale form forcing • Seasonal 90 days cyclic external • El nino 3-5 yrs cyclic internal • North Atlantic Oscillation decadal cyclic internal?? • Volcanism none episodic external • Ice ages 40,000 yrs cyclic internal • Pacific Decadal 20-50 yrs cyclic ????
North Atlantic Oscillation The NAO index is defined as the anomalous difference between the polar low and the subtropical high during the winter season (December through March)