Download
1 / 21
210 likes | 219 Views
Learn how GPS meteorology can improve severe weather forecasts in California, including the use of GPS signals to estimate water vapor and monitor atmospheric conditions.

E N D
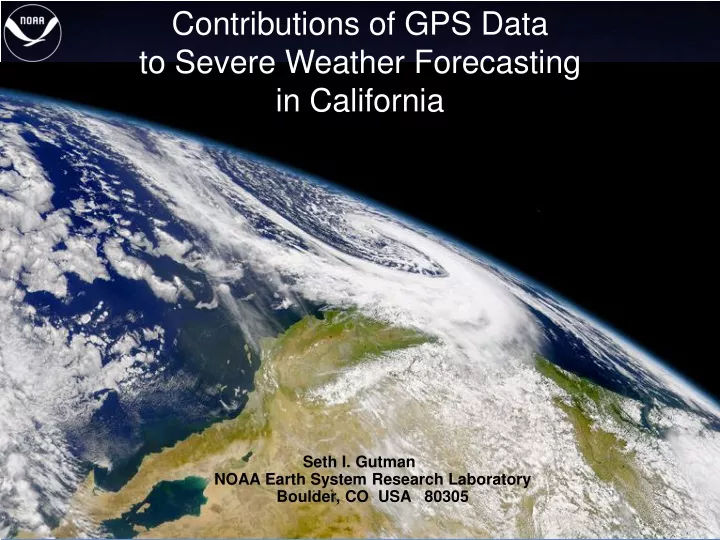
Contributions of GPS Data to Severe Weather Forecasting in California Seth I. Gutman NOAA Earth System Research Laboratory Boulder, CO USA 80305
Outline • Background • What is GPS Meteorology? • The storm of 4-5 January 2008 • Advances in monitoring and prediction • Other applications • Conclusions
Jian-Wen Bao1 Dan Gottas2 Kirk Holub1 Isidora Jankov2 Dave Kingsmill2 John McGinley1 Sara Michelson2 Paul Neiman1 Marty Ralph1 Allen White1 Tim Schneider1 Acknowledgements 1 NOAA Earth System Research Laboratory, Boulder, CO 80305 USA 2 Cooperative Institute for Research in Environmental Sciences, University of Colorado Boulder, CO 80305 USA
Background • When GPS was designed for the U.S. military, the use of GNSS for atmospheric remote sensing was probably the last application on their minds. • It’s also reasonable to assume that the techniques developed by geodesists to estimate atmospherically induced signal delays as nuisance parameters and (2) remove them to improve survey accuracy, were not developed to improve weather forecasts. • So the recognition that ground based GNSS observations could be used to study the atmosphere can rightfully be called serendipitous. • This is how GPS Meteorology works and how NOAA is using it to improve its severe weather forecasts and warnings in California.
Background • Water vapor is one of the most important components of the Earth’s atmosphere. • It is the source of clouds and precipitation, and an ingredient in most major weather events. • PW moves rapidly through the atmosphere, redistributing energy (latent heat) through evaporation and condensation. • One of the most valuable attributes of GNSS is its ability to provide accurate water vapor estimates under all weather conditions, including thick cloud cover and precipitation.
Background • Water vapor also plays a critical role in the global climate system: • It is by far the most plentiful greenhouse gas; • It absorbs and radiates energy from the sun; • It affects the formation of clouds and aerosols and the chemistry of the lower atmosphere; • So understanding & monitoring water vapor, and the effects it has on atmospheric radiation and circulation, is vital to the diagnosis and prognosis of long-term changes in climate including droughts & severe weather.
Overview of GPS Meteorology • GPS Signal in Troposphere • Refractivity associated with changes in T,P,WV in neutral atmosphere. • Signal delays are unrelated to frequency below 30 GHz. • Delays must be modeled using assumptions about the structure and length-scale variability of these parameters. • GPS Signal in Ionosphere • Refractivity associated with changes in electron plasma density or TEC between 50 and 400 km AGL. • Signal delays in dispersive media are inversely proportional to frequency. • Ionospheric delays are estimated (or removed) using dual frequency receivers.
GPS Water Vapor Measurements January 01, 2008 to January 14, 2008 (08001 to 08014) Point Loma, CA (PLO5)La Jolla, CA (SIO3)San Diego, CA (NKXB)
Major West Coast Storm 4-5 January 2008 • Blizzard warning • Heavy snow warning • Winter storm warning • Flash flood watch • Flood warnings • Coastal flood watch • Coastal flood warning • Gale warning • Heavy surf warning • High wind warning • many others….
What Happened • An exceptionally strong Extratropical Cyclone (a low pressure system) traversed much of the Pacific Ocean before the first main wave arrived late on January 3. • The storm entrained moisture (water vapor) from the subtropics in a long narrow region called an “Atmospheric River.” • The storm (actually a series of three storms) impacted the Pacific Coast from British Columbia to northern Mexico.
What Happened • Atmospheric rivers (AR’s) are formed as part of the "warm conveyor belt", a hemispheric cycle by which the cold dry air of the Arctic flows southward, and warm humid air from the tropics is forced northward. • This "conveyor belt" plays a key role in the formation of Pacific storms. • Modeling studies suggest that more than 90% of the total water vapor transported from the equator toward the poles are concentrated in these rivers.
What Do AR’s Look Like? Atmospheric rivers (AR’s) represent the “business end” of west coast winter storms. Due to lack of observations, AR’s are poorly defined, monitored, and forecast.
6-10 ft snow ~500 miles 7-13 in rain The storm at time of major impact Note that major impacts were focused >500 miles south of the Low pressure center in this storm. This differs significantly from hurricanes, but the impacts are enormous and spread over a large area L Many major impacts are associated with the landfall of the “atmospheric river” element of the storm, the precise characteristics of which are not currently monitored operationally offshore or onshore. Atmospheric river • GOES IR image of major West Coast storm • Time = 0030 UTC 5 January 2008 • Low pressure center is off WA coast
Three experimental observing sites monitored AR conditions upon land-fall • Each “site” ( ) includes • coastal wind profiler • GPS receiver • surface met package • rain gauge • The integrated observing strategy has been developed from past experiments, and the sites are deployed as part of the Hydrometeorology Testbed, Coastal Storms Program, and “Weather-climate connection” projects. 500 km L BBY PPB GLA Distance from BBY to GLA ~500 km, i.e. the average width of an atmospheric river Bodega Bay (BBY; 12 m MSL) + Cazadero (Mountain site; 475 m MSL) Pt. Piedras Blancas (PPB; 11 m MSL) + Three Peaks (Mountain site; 1021 m MSL) Goleta (GLA; 3 m MSL) + San Marcos Pass (Mountain site; 701 m MSL)
Typical AR Monitoring Site Bodega Bay (BBY) Radar Wind Profiler (1) Surface Met Sensors (2) GPS Receiver and Antenna (3) (1) (2) & (3)
IPW AR 10.39” rain in 34h 01/07 01/06 01/05 01/04 01/04 01/02 01/01 GPS Water Vapor Measurements January 01, 2008 to January 07, 2008 (08001 to 08007) Bodega Bay, CA (BBY5)
Observations at Bodega Bay (upslope orientation = 230 deg) Max AR bulk flux: 115 units (total); 100 units (upslope component) Time of max AR flux: 1500-1600 UTC 4 January 2008 Max wind in controlling layer (hourly avg): 39.4 m s-1; 194 deg Max IPW: 31.1 mm Max hourly rain rate: 0.8 in h-1 (20 mm h-1) Storm total rainfall at nearby mountain site: 10.39 in (264 mm) Wind speed, direction & return signal power from wind profiler Upslope wind speed and IPW from wind profiler and GPS IPW flux and rain rate from profiler, GPS & rain gauge
Conclusions • A new forecast model moisture flux verification tool has been developed by NOAA’s Earth System Research Laboratory. • The tool combines observations and NWP model output to maintain situational awareness and evaluate weather model performance. • Plans are being made to transition the observing systems and moisture flux tool from NOAA Research into National Weather Service operations.
Contact Information: Seth I. Gutman, Physical Scientist NOAA Earth System Research Laboratory (ESRL) 325 Broadway R/GSD7 Boulder, CO 80305-3328 Phone: (303) 497-7031 FAX: (303) 497-6014 Email: Seth.I.Gutman@noaa.gov Web: http://gpsmet_test.fsl.noaa.gov.
Thanks for your Attention! Any Questions?