Download
1 / 40
420 likes | 632 Views
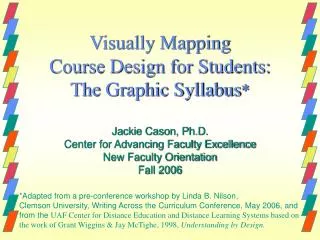
The Graphic Syllabus: Communicating Your Course C r e a t i v e l y. Linda B. Nilson, Ph.D., Director Office of Teaching Effectiveness and Innovation 864-656-4542 * nilson@clemson.edu * www.clemson.edu/OTEI

E N D
The Graphic Syllabus:Communicating Your Course Creatively Linda B. Nilson, Ph.D., Director Office of Teaching Effectiveness and Innovation 864-656-4542 * nilson@clemson.edu * www.clemson.edu/OTEI Steven N. Pyser, J.D., Assistant Professor (Practice) Department of Human Resource Management, Fox School of Business (215) 204-4281 * SNPyser@temple.edu
Introduction • What if you could … • directly and positively influence student learning and improve business education • visualize simply for students ambiguity, complexity and connections between course content and your design • (re)capture your passion for learning and link subject matter expertise with the energy and momentum of the Fox School
"Too much light often blinds gentlemen of this sort. They cannot see the forest for the trees." Musarion [1768], Canto II
Workshop Inspiration Mentoring Appreciation (Pyser) http://chronicle.com/blogs/profhacker/graphic-display-of-student-learning-objectives/27863
Participant Objectives By the end of this workshop, you will be able to communicate the topical organization of your course to your students by designing a “graphic syllabus.” In doing so, youwill also facilitate their learning of the course material.
Syllabus Review: Foundation for Students Evaluations Will they be under/overwhelmed??
Applied Pracademics (Practice/Academics) • real-world practice and research driven academics (combining rigor AND pragmatism) • infuse critical thinking, problem solving and decision making into the daily thinking of business students and class interactions • engender understanding → content mastery → with a context to simulate "real-world" business environment students experience after graduation
Visual Graphic Syllabus and Communication Perspective • What are we making together? • How are we making it? • What are we becoming as we make this? • How can we make better “social worlds” through histories, futures, and networks of classroom relationships? http://www.cmminstitute.net/
Education as “Social” Experience • Social capital • institutions, relationships, norms that shape quality and quantity of a society's social interactions. • social cohesion is critical for societies to prosper • Social worlds (CMM) • allows faculty and students fertile ground to learn • graphic syllabus is visual communication • create synergies between human and academic sides of the classroom to build learning communities http://www.russcomm.ru/eng/rca_biblio/p/pearce.shtml
Why Design a Graphic Syllabus? • Text syllabi fail because they: 1. depict a complex structure of knowledge--a network of topics, concepts, and principles--as linear; and 2. require familiarity with the terms, which students lack, to understand.
How Some Students See a Syllabus • BLAH 300: “Something I Gotta Take” • Week 1: Overview of Something I Gotta Take • Week 2: The Composition of Apple Peel • Week 3: Introduction to Giraffe Consciousness • Week 4: Cooking with Sugar and Eggs • Week 5: Sugar and Eggs continued • Week 6: The Modern Car: The Carburetor • Week 7: The Modern Car: Seat Belts • Week 8: Advanced Giraffe Consciousness, • Introduction to Pineapples • Week 9: The Relationship between Pineapples • and Buses etc., etc., etc.
Why Design…? continued • Learning styles: visual, kinesthetic, concrete, holistic/global, “Divergers,” “Intuitive Feelers” • Better retention & retrieval of material received 1) in two modalities and 2) visually (more efficient, less working memory and fewer cognitive transformations) • “Big picture” of key concepts and their interrelationships; ready-made structure for knowledge processing and storage
Why Design…? continued • Model tool for enhancing cognitive activities involving memory, planning, and organizing. • For students: note-taking, outlining, problem solving, and organizing & summarizing material • For you:re-examine and tighten your course design … and have some creative fun!
Graphic Syllabus = flowchart, diagram, or picture showing the organization of and interrelationships among your course topics – that is, how your course structures the subject matter and its body of knowledge.
Types of Course Structures • Competition/Complementarity • Parallelism • Process • Chronology (Sequence) • Categorical Hierarchy • Self-Created
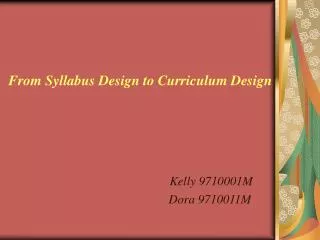
HSCI 441: Community Program Planning, Dr. Vicki Ebin Introduction, Health Education and Behavior Change Theories, Systems Theories (2/1-2/8) Community Analysis (2/8-2/15) Community Diagnosis Level II (2/15) Community Diagnosis Level III (2/22) Program Goals/Objectives Methods/Activities Intervention Strategies Implementation Evaluation Targeted Surveys/ Analysis Program Focus (3/1) (3/8-3/15) The Final Product (3/22-5/17)
Steven N. Pyser (2012) Fox School of Business, Temple University
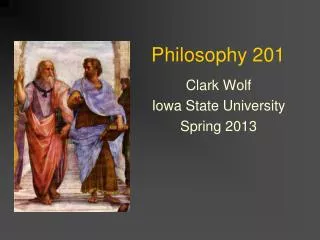
ME 404: Manufacturing Processes and Their Application, Professor Laine Mears DESIGN INDUSTRIAL MANUFACTURING Integration Interpretation Quality Time • QFD • GD & T • Metrology • SPC • Push / Pull • Lean Mfg. Design for X Process Planning PROCESSES Material Removal Material Transformation Material Addition Machining Processes Sheet Metal Casting Processes Bulk Deform. Polymer Processes Joining Adhesion Rapid Prototyping • Turning • Milling • Drilling • other • Bending • Stamping • Blanking • Punching • Sand casting • Diecast • Investment • other • Forging • Rolling • Extrusion • Drawing • Inj. Molding • Blow molding • Rotomold • other • Welding • Brazing • SLA • SLS • 3D Printing • other
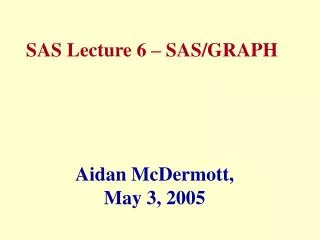
CULTURE Sharon Shaughnessy 2006, Univ. of Toronto Study of Culture & Psychology Basic Dimensions of Cultural Variability CULTURE Social Systems Identity/Ethnicity Self Research Methods Cognition Development Emotion Personality Abnormal Social Behavior
The auditory system The visual system Sound localization Object Perception Colour perception The sixth sense: proprioception Depth perception Touch Motion perception Christine Burton 2006, Univ. of Toronto Some history: Why and how we study perception Perceptual awareness and attention The chemical senses: Smell and taste
Variations in Graphic Syllabi Shapeof enclosures Shadingof key enclosures, activities, assignments, etc. Colors of enclosures and connecting lines Typesize, face, features (bold, italics) Arrangements
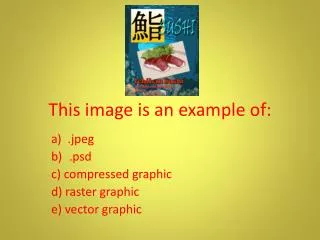
Graphic Metaphor • Type of graphic syllabus that compares topical course organization to some object.
Cautions! • Avoid overcomplexity. • Course flows in ONE direction following TIME through semester. No recursive relationships • Structure of course topics or the learning process – not the field, a theory, a model, etc. • Don’t forget to refer to it frequently!