Download
1 / 39
440 likes | 734 Views
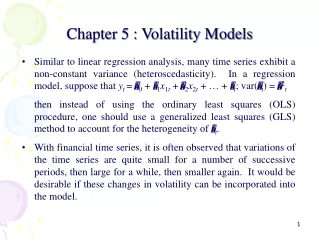
Chapter 14 Time-Varying Volatility and ARCH Models. Walter R. Paczkowski Rutgers University. Chapter Contents. 14.1 The ARCH Model 14.2 Time-Varying Volatility 14 .3 Testing, Estimating, and Forecasting 14 .4 Extensions.

E N D
Chapter 14 Time-Varying Volatility and ARCH Models Walter R. Paczkowski Rutgers University
Chapter Contents • 14.1 The ARCH Model • 14.2 Time-Varying Volatility • 14.3 Testing, Estimating, and Forecasting • 14.4 Extensions
The nonstationary nature of the variables studied earlier implied that they had means that change over time • Now we are concerned with stationary series, but with conditional variances that change over time • The model is called the autoregressive conditional heteroskedastic (ARCH) model • ARCH stands for auto-regressive conditional heteroskedasticity
14.1 The ARCH Model
14.1 The ARCH Model • Consider a model with an AR(1) error term: Eq. 14.1a Eq. 14.1b Eq. 14.1c
14.1 The ARCH Model • The unconditional mean of the error is: • The conditional mean for the error is:
14.1 The ARCH Model • The unconditional variance of the error is: • The conditional variance for the error is:
14.1 The ARCH Model • Suppose that instead of a conditional mean that changes over time we have a conditional variance that changes over time • Consider a variant of the above model: • The second equation says the error term is conditionally normal Eq. 14.2a Eq. 14.2b Eq. 14.2c
14.1 The ARCH Model • The name — ARCH — conveys the fact that we are working with time-varying variances (heteroskedasticity) that depend on (are conditional on) lagged effects (autocorrelation) • This particular example is an ARCH(1) model
14.1 The ARCH Model • The standardized errors are standard normal: • We can write:
14.2 Time-Varying Volatility
14.2 Time-Varying Volatility • The ARCH model has become a popular one because its variance specification can capture commonly observed features of the time series of financial variables • It is useful for modeling volatility and especially changes in volatility over time
14.2 Time-Varying Volatility FIGURE 14.1 Time series of returns to stock indices
14.2 Time-Varying Volatility FIGURE 14.2 Histograms of returns to various stock indices
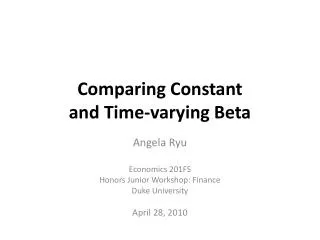
14.2 Time-Varying Volatility FIGURE 14.3 Simulated examples of constant and time-varying variances
14.2 Time-Varying Volatility FIGURE 14.4 Frequency distributions of the simulated models
14.2 Time-Varying Volatility • The ARCH model is intuitively appealing because it seems sensible to explain volatility as a function of the errors et • These errors are often called ‘‘shocks’’ or ‘‘news’’ by financial analysts • They represent the unexpected! • According to the ARCH model, the larger the shock, the greater the volatility in the series • This model captures volatility clustering, as big changes in et are fed into further big changes in ht via the lagged effect et-1
14.3 Testing, Estimating, and Forecasting
14.3 Testing, Estimating, and Forecasting • A Lagrange multiplier (LM) test is often used to test for the presence of ARCH effects • To perform this test, first estimate the mean equation 14.3.1 Testing for ARCH Effects Eq. 14.3
14.3 Testing, Estimating, and Forecasting • Consider the returns from buying shares in the hypothetical company Brighten Your Day (BYD) Lighting 14.3.1 Testing for ARCH Effects
14.3 Testing, Estimating, and Forecasting FIGURE 14.5 Time series and histogram of returns for BYD Lighting 14.3.1 Testing for ARCH Effects
14.3 Testing, Estimating, and Forecasting • The results for an ARCH test are: • The t-statistic suggests a significant first-order coefficient • The sample size is 500, giving LM test value of (T – q)R2 = 61.876 • Comparing the computed test value to the 5% critical value of a χ2(1) distribution (χ2(0.95, 1)= 3.841) leads to the rejection of the null hypothesis • The residuals show the presence of ARCH(1) effects. 14.3.1 Testing for ARCH Effects
14.3 Testing, Estimating, and Forecasting • ARCH models are estimated by the maximum likelihood method 14.3.2 Estimating ARCH Models
14.3 Testing, Estimating, and Forecasting • Eq. 14.4 shows the results from estimating an ARCH(1) model applied to the monthly returns from buying shares in Brighten Your Day Lighting 14.3.2 Estimating ARCH Models Eq. 14.4a Eq. 14.4b
14.3 Testing, Estimating, and Forecasting • For our case study of investing in Brighten Your Day Lighting, the forecast return and volatility are: 14.3.3 Forecasting Volatility Eq. 14.5a Eq. 14.5b
14.3 Testing, Estimating, and Forecasting FIGURE 14.6 Plot of conditional variance 14.3.3 Forecasting Volatility
14.4 Extensions
14.4 Extensions • The ARCH(1) model can be extended in a number of ways • One obvious extension is to allow for more lags • An ARCH(q) model would be: • Testing, estimating, and forecasting, are natural extensions of the case with one lag Eq. 14.6
14.4 Extensions 14.4.1 The GARCH Model – Generalized ARCH • One of the shortcomings of an ARCH(q) model is that there are q + 1 parameters to estimate • If q is a large number, we may lose accuracy in the estimation • The generalized ARCH model, or GARCH, is an alternative way to capture long lagged effects with fewer parameters
14.4 Extensions 14.4.1 The GARCH Model – Generalized ARCH • Consider Eq. 14.6 but write it as: Eq. 14.7
14.4 Extensions 14.4.1 The GARCH Model – Generalized ARCH • This generalized ARCH model is denoted as GARCH(1,1) • The model is a very popular specification because it fits many data series well • It tells us that the volatility changes with lagged shocks (e2t-1) but there is also momentum in the system working via ht-1 • One reason why this model is so popular is that it can capture long lags in the shocks with only a few parameters
14.4 Extensions 14.4.1 The GARCH Model – Generalized ARCH • Consider again the returns to our shares in Brighten Your Day Lighting, which we reestimate (by maximum likelihood) under the new model:
14.4 Extensions FIGURE 14.7 Estimated means and variances of ARCH models 14.4.1 The GARCH Model – Generalized ARCH
14.4 Extensions 14.4.2 Allowing for an Asymmetric Effect • The threshold ARCH model, or T-ARCH, is one example where positive and negative news are treated asymmetrically • In the T-GARCH version of the model, the specification of the conditional variance is: Eq. 14.8
14.4 Extensions 14.4.2 Allowing for an Asymmetric Effect • The returns to our shares in Brighten Your Day Lighting were reestimated with a T-GARCH(1,1) specification:
14.4 Extensions 14.4.3 GARCH-In-Mean and Time-Varying Risk Premium • Another popular extension of the GARCH model is the ‘‘GARCH-in-mean’’ model Eq. 14.9a Eq. 14.9b Eq. 14.9c
14.4 Extensions 14.4.3 GARCH-In-Mean and Time-Varying Risk Premium • The returns to shares in Brighten Your Day Lighting were reestimated as a GARCH-in-mean model:
Keywords GARCH GARCH-in-mean T-ARCH and T-GARCH time-varying variance • ARCH • ARCH-in-mean • conditional and unconditional forecasts • conditionally normal