Download
1 / 67
680 likes | 692 Views
Time Varying Risk Aversion. Luigi Guiso (Einaudi Institute for Economics & Finance- EIEF) Paola Sapienza (Northwestern University) Luigi Zingales (University of Chicago) Banca d ’ Italia, December 3 2015. Large Fluctuations In The Discount Rate and Asset Prices.

E N D
Time Varying Risk Aversion Luigi Guiso (Einaudi Institute for Economics & Finance- EIEF) Paola Sapienza (Northwestern University) Luigi Zingales (University of Chicago) Banca d’Italia, December 3 2015
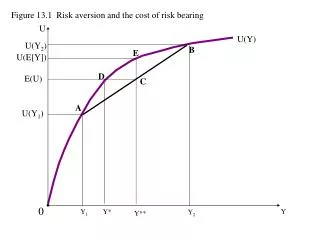
Large Fluctuations In The Discount Rate and Asset Prices Campbell, Giglio, and Polk, 2011 show that at the end of 2008 there was a sharp change in the aggregate discount rate.
Where do they come from? Fluctuations in the individual risk aversion Shifts in the distribution of wealth that change the aggregate risk aversion Changes in “sentiment”
What Explains Them? • If changes in individual risk aversion, what explains them? • Changes in wealth ? • Due to habit persistence ? • Due to loss version? • Changes in preferences (curvature)? • Why? • At the center of the debate on rationality of markets • At the center of the debate on fair value accounting
This Paper • All the evidence points to a change in the aggregate risk aversion around the crisis. • In this paper we study whether around the crisis • Individual risk aversion changes • These changes are large enough to explain changes in the aggregate risk aversion • What can explain these changes
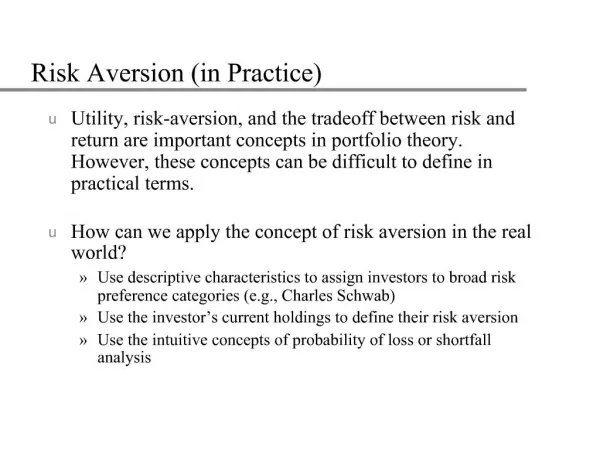
How to Measure Risk Aversion? Indirectly: • From asset prices’ movements: self referential • From holdings of risky assets: a) need assume homogenous beliefs; b) adjustment costs bias results Directly: 1. Experiments: • Selected participants; Limited size gambles 2. Survey based: • Hypothetical questions but • external validation • lots of control
Sample • Sample of 1,686 random clients of a major Italian bank (Unicredit) first sampled in 2007. • With respect to Italian population: • Richer, More North than South, a bit older than average • Re-interviewed in June 2009 with a much more limited set of questions: 1/3 response rate, no evidence of selection
Datacontent • For all the sample (even non respondents) we have administrative records on • 26 financial assets categories at this bank before and after the crisis (stocks and flows) • We know the proportion of financial wealth held at the bank • We have the value of the house • Can estimate stock of wealth and its change
Risk Aversion Questions: 1 • Qualitative (SCF): “when I invest I try to achieve” • Very high returns, even at the risk of a high probability of losing part of my principal • A good return, but with an OK degree of safety of my principal; • A OK return, with good degree of safety of my principal • Low returns, but no chance of losing my principal
Risk Aversion Questions: 2 • Quantitative: “Imagine being in a room. To get out you have two doors. Behind one of the two doors there is a 10,000 euro prize, behind the other nothing. Alternatively, you can get out from the service door and win a known amount.” [Deal or no deal] => If you were offered 100s euro, would you choose the service door? • 500, 1500, 3000, 4000, 5000, 5500, 7000,9000, > 9000 • Allows to obtain an estimate of the investor (absolute) certainty equivalent [Holt & Laury, AER ]
Quantitative Measure 100 3000 5000 9000 1500 >9000 500 7000 4000 5500
Self Assessment • After the financial crisis, in your investment choices you are: 0: More or less like before 1: More cautious 2: Much more cautious
Outline • Are these measures just noise? • Did they change? • Did they change enough? • Why did they change? • An hypothesis • An experiment • Conclusions
1 Are These Measures Just Noise?
Check Consistency • Consistency across measures • Consistency over time • Correlated with self-assessment • Correlated with actual choices • Level predict stockholding in 2007 • Change predicts change in risky assets holding and in risky asset share
TVRA 2 Did These Measures Change?
Did Risk Aversion Change? : Qualitative Indicator Moderate RET & RIS Medium RET & RIS No risk No risk High RET & High RIS i 2007 2009
DidRisk Aversion Change: Quantitative Measure 2009 2007 2007 2009 Mean Median Certainty Equivalent
3 Did They Change Enough?
Magnitude • These changes imply an increase • in the average risk premium from 800 to around 2,200 euros and • in median risk premium from 1000 to 3500 euros. • These estimates imply that • average risk aversion increased by a factor of 2.7 • the median risk aversion by a factor of 3.5! • Since net worth decreased on average by 6% between end of 2007 and June 2009 most of the change is a change in relative risk aversion
Does change in individual risk aversion drives aggregate risk aversion?
4 What Does Explain These Changes?
Natural candidates • Changes in wealth because of preferences with habits 2. Experienced losses in Loss-Gains utility models (Barberis, Huang, Santos, 2001) – after the initial hit, investors are “fragile”, “shaken up” – can’t take any more bad news => become more risk averse => Negative correlation between financial losses (change in wealth) and change in risk aversion
Evidence: non parametric • Estimate non parametric relation between change in risk aversion and financial losses during the crisis • Financial loss: • Proportional loss in financial portfolio between September 2008 (pre-Lehman) and February 2009 (bottom of stock market)
Change in qualitative indicator Half of the sample • RA increases for all groups, even those experiencing no losses ; • no negative correlation
Change in CE of quantitative indicator (Change in CE)/expected value of lottery Half of the sample Correlation should be strongly positive. CE increases for all even at no losses; no positive correlation
Change in CE and change in total wealth (Change in CE)/expected value of lottery
Summing • No correlation between financial losses and qualitative indicator • Some positive correlation with CE using quantitative indicator for large losses • Consistent with loss aversion models
What about those who suffer no losses? (295 individual, half of the sample) • CE decreases as in total sample also for those who experience no loss or even gain • Same if we look at qualitative indicator (change of similar magnitude as in total sample)
Other channels/objections • Background risk: • Risk of unemployment and earnings variability => Public employees and retirees are completely shielded • Reduction in future earnings => Should have a larger effect on the RA of the younger than that of the older (if shocks to income persistent)
Background risk & non losses CE equivalent does not drop less for those facing less background risk (same if use qualitative measure)
Drop in future earnings& no losses CE equivalent does not drop more for the young who have a longer horizon , qualitative indicator of RA does not increase more
Expectations and Risk Aversion? • Do people mix expectation and risk aversion? • We elicited the subjective distribution of stock returns in 2007 and 2009 • Obtain a measure of the change in expected stock market return and of change in uncertainty about stock market returns • Both have no effect on RA • Some evidence that a measure of change knightian uncertainty and trust has affected change in RA
Conclusions so Far • Survey measures of risk aversion increase substantially after the crisis • Even individuals holding only safe assets see their risk aversion go up. • Changes not driven by losses, changes in wealth, or background risk. • In fact, none of the existing models can explain them -> deficient models ?
5 An Hypothesis
The Neuro Biology of Fear • Increasing number of studies have identified the neurological bases of risk aversion. • De Martino et al. (2010): amygdala-damaged patients take risky gambles much more often • Kuhnen and Knutson (2005): activation anterior insular followed by an increase in risk aversion. • KK (2011): erotic pictures induce people to take risk, while negative emotions have the opposite effects.
An Hypothesis Risky decisions are made by the frontal lobe (the computational part of the brain) The frontal lobe takes for granted the “values” (parameters of the utility function). A scary experience activates the amygdala, which sends signal to the frontal lobe to be more risk averse in its calculations. How to prove it?
5 An Experiment
The Experiment • We conducted a laboratory experiment with students at Northwestern. • In the lab everything (background risk, expectations, etc.) is controlled for. • Treat half of participants with an excerpt from the 2005 movie, “The Hostel” (2007 best horror movie) • Face all with the same risky choice questions as in sample of investors • Does an horror movie experience change the risk aversion? By as much as in the data?
Heterogeneity • Not everybody is scared the same. • Some people like horror movies. • Does the impact differ depending on how scared you were? • In half of the sample we asked people how much they liked horror movies on a scale from 0 to 100. • Roughly a third do not like it at all