Download
1 / 23
260 likes | 419 Views
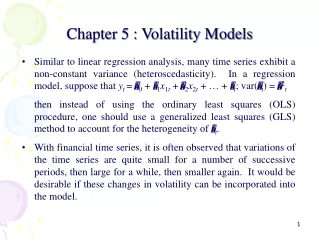
Fin250f: Lecture 11.2 Spring 2010 Reading: Brooks chapter 8. Volatility Models. Outline. Stochastic volatility ARCH(1) GARCH(1,1) GARCH(p,q) GJR and volatility asymmetry High/low volatility time series modeling and long range persistence. Stochastic Volatility. Stochastic Volatility.

E N D
Fin250f: Lecture 11.2 Spring 2010 Reading: Brooks chapter 8 Volatility Models
Outline • Stochastic volatility • ARCH(1) • GARCH(1,1) • GARCH(p,q) • GJR and volatility asymmetry • High/low volatility time series modeling and long range persistence
Stochastic Volatility • Very straightforward • Difficult to estimate • Related to high/low range estimation
ARCH(1)Autoregressive Conditional Heteroskedasticity (Engle)
ARCH(1) • Alpha(1) < 1 • Alpha(0) > 0 • Squared return correlations not persistent enough • Not very useful in finance
GARCH(1,1)(Bollerslev) Generalized Autoregressive Conditional Heteroskedasticity
GARCH(p,q)Generalized Autoregressive Conditional Heteroskedasticity
ARMA(1,1)/GARCH(1,1)Generalized Autoregressive Conditional Heteroskedasticity
Volatility Diagnostics • Squared and absolute returns:Send into usual time series tests • ACF • PACF • Ljung/Box • Engle test (TR^2): Box 8.1
Engle Test • Find residuals of linear model: u(t) • Regress u(t)^2 on lags, u(t-1)^2, u(t-2)^2,…u(t-q)^2 • Get R-squared from this regression • Calculate T*(R-squared) • Chi-squared(q)
GARCH(1,1) • Most heavily used volatility model on Wall St. • Estimation: • maximum likelihood (not too difficult) • matlab: garcheasy.m
Modifications • EGARCH (log form) • TARCH (threshold nonlinearitiy) • IGARCH (volatility follows random walk) • Asymmetry • For stocks (only) volatility increases by larger amount on market falls • One (of many) models: GJR • Glosten, Jagannathan and Runkle
Volatility Modeling Beyond GARCH • Use other estimates (beyond squared returns) for volatility • VIX • Intraday data (realized volatility) • High/low range information • Build daily estimates of volatility • Apply standard time series tools to volatility or log(volatility)
Modeling Using High/low ranges • voltests.m • Back to the problem of long range correlations and modeling • Special methods • Multi-horizon regressions • Asymmetric volatility impact • One other method • Long memory/fractional integration
Volatility Summary • Lots of predictability (for finance) but, • No perfect model (sort of GARCH(1,1) • Do different objectives matter? • What about out of sample • Some puzzles remain • Long range persistence • Some nonnormal residuals • Sign asymmetry and other nonlinear effects • Connections to trading volume • Basic issue: Why is it changing?