Download
1 / 23
230 likes | 369 Views
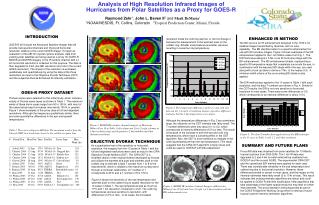
A High Resolution Daily SST Analysis. Richard W. Reynolds (NOAA, CICS) Dudley B. Chelton (Oregon State University) Thomas M. Smith (NOAA, STAR). Background. The Group for High Resolution SST (GHRSST) supports many high resolution SST products

E N D
A High Resolution Daily SST Analysis Richard W. Reynolds (NOAA, CICS) Dudley B. Chelton (Oregon State University) Thomas M. Smith (NOAA, STAR)
Background • The Group for High Resolution SST (GHRSST) supports many high resolution SST products • There are differences in input data, grid resolution, analysis procedures • There are important differences in analyzed SSTs and analysis resolution • Reynolds and Chelton compared 6 SST analyses for 2006-08 to try to identify analysis problems and determine which analyses are superior
SST Analyses,1 January 2007 • RSS OI • (~1/11)°grid • NCEP RTG-HR • (1/12)°grid • UK OSTIA • (1/20)°grid • NCDC Daily OI: (AMSR + AVHRR) • (1/4)°grid • This is a daily average • What spatial scales are justified?
SST Analyses,1 January 2007 • RSS OI • (~1/11)° grid • NCEP RTG-HR • (1/12)°grid • UK OSTIA • (1/20)°grid • NCDC Daily OI: (AMSR + AVHRR) • (1/4)°grid • This is a daily average • What spatial scales are justified?
Results • RSS has too much variability compared to buoys at middle and high frequencies • There is no clear correlation between resolution and spatial grid size • Is there a better way to do analyses?
Two Stage Analysis • Low Resolution (25 km) analysis using microwave and infrared satellite data plus in situ data • High Resolution (4.4 km) analysis using infrared satellite data only
Why Two Stages? • Both microwave (MW) and infrared (IR) satellite data are now available • Microwave has better coverage than infrared • Infrared has higher resolution than microwave • “2-Stage Analysis” allows processing to take advantage of both types of data
Two Stages 4.4 km IR Daily OI 25 km MW and IR Daily OI
Analysis DifferencesHigh – Low • Upper panel: No filter of Pathfinder AVHRR • Note bull’s eyes: especially along 145°E • Lower panel: Median filter of Pathfinder AVHRR • Data extremes tossed by eliminating data where the |median – observation| > 0.8°C • Fewer bull’s eyes
RMS monthly differences:High – Low • Upper panel: January 2003 • Lower panel: July 2003 • Note regions with little difference (no AVHRR hi-res signal) • Gulf Stream in January • Off Peru/Columbia coast in July
California Current Region: SST (oC) • Rest of SST pictures will focus on this region • The figure shows an unusual day with no clouds • Note complex interweaving SST patterns • Coastal upwelling • If all days were like this SST analysis would be simple
11 September 2003: Hi-Res & Low-Res OI SST (oC) |Gradient| (oC/100 km)
11 Sep. ‘03SST Gradient: (°C/100 km) • Upper panel: Hi-Res • qualitatively similar to what is expected • Middle panel: Low-Res • Lower panel: OI Hi-Res Normalized Error • Norm. Error ~1.0 if no Hi-Res Data • Norm. Error < 0.8 with Hi-Res Data
11 Sep. ‘03SST Gradient: (°C/100 km) • Upper panel: Hi-Res • Middle panel: Low-Res • Lower panel: Diff. (Hi-Res – Low-Res) • With Hi-Res Normalized Error 0.8 Contour • Note correlation between contour and high gradients • Highest SST gradients are likely due to cloud contamination
2-Stage Analysis High Resolution Analysis: using 3 days Pathfinder AVHRR data Shows promise The high-res analysis resolution is only improved when high resolution data are available Some further tuning needed to improve gradients
High Resolution SST Analyses What have we learned? SST gradients are a powerful way to investigate the truth of small-scale features Where do we go from here?
Goldilocks & the 3 Bears Need to help users find the SST analysis that “is just right”
Is it Real or is it Memorex? Advertisement from the 1990s implying that a live and a Memorex taped performance were the same
Suggestions for Improving SST Analyses - 1 Intercompare the input data Look for and reduce isolated extremes Consider median filtering Be careful at boundaries between regions with and without data • Computing an analysis is a bit like making sausage • The input impacts the output
Suggestions for Improving SST Analyses - 2 Compute several versions Do intercomparsions among these versions and with other analysis products to uncover problems Compute gradients Look for large gradients at the boundaries between regions with and without data Share results with others
GHRSST & High Resolution Signal and Noise must be Balanced in an SST Analysis Reynolds & Chelton GHRSST