Download
1 / 18
180 likes | 288 Views
Intercomparisons Among Global Daily SST Analyses. Richard W. Reynolds (NOAA, NCDC) Dudley B. Chelton (Oregon State University). NOAA’s National Climatic Data Center Asheville, NC, USA. Introduction. GHRSST has resulted in many high resolution SST products

E N D
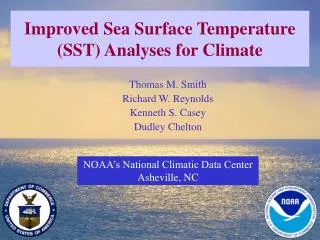
Intercomparisons Among Global Daily SST Analyses Richard W. Reynolds (NOAA, NCDC) Dudley B. Chelton (Oregon State University) NOAA’s National Climatic Data Center Asheville, NC, USA
Introduction • GHRSST has resulted in many high resolution SST products • Differences in input data, grid resolution, analysis procedures • Important differences in analyzed SSTs and analysis resolution • The purpose here is try to identify analysis problems and determine which analyses are superior • If an analysis resolution is set too fine, all you will get is noise
Goldilocks & the 3 Bears Need to help users find the SST analysis that “is just right”
Satellite Data for 25 March 2006 • AVHRR day & night • Note data scarcity due to clouds • AMSR day & night • Note swath width • Missing data due to land, precipitation • Day night differences not always due to diurnal warming
4 Days of Buoy SST Data0Z 22 March 22 - 0Z 26 March 26, 2006 • Resolution • 1 minute • Averaged to • 1 hour • 1 day • Consider random sampling • AMSR could approach 2 obs/day • AVHRR would be lower especially in winter Thanks to Bob Weller
SST Analyses,1 January 2007 • RSS OI • (~1/11)°grid • NCEP RTG-HR • (1/12)°grid • UK OSTIA • (1/20)°grid • NCDC Daily OI: (AMSR + AVHRR) • (1/4)°grid • This is a daily average • What spatial scales are justified?
SST Analyses,1 January 2007 • RSS OI • (~1/11)° grid • NCEP RTG-HR • (1/12)°grid • UK OSTIA • (1/20)°grid • NCDC Daily OI: (AMSR + AVHRR) • (1/4)°grid • This is a daily average • What spatial scales are justified?
Gulf Steam East Coast Auto SpectraAveraged over 5 buoy locations • Spectra for Buoys and 4 Analyses • Vertical axis is logarithmic • Note • All daily analyses lower than buoys at middle and high frequencies • RSS slightly higher than other analyses
Tropical West Pacific Auto SpectraAveraged over 10 buoy locations • RSS higher than buoys and other analyses at middle and high frequencies • RSS highest resolution details persist between IR satellite observations
Average Cross Correlation Analysis with respect to buoys Cross Correlation GS East Coast Trop. W Pacific
Gulf Steam East Coast AverageSquared CoherenceBetween Buoys and 4 Analyses: 5 buoy locations • OSTIA drops below 0.28 at ~0.2 cycles/day (5 day period) • Daily OI drops below 0.28 at ~0.15 cycles/day (7 day period) • RTG-HR drops below 0.28 at ~0.1 cycles/day (10 day period) • RSS drops below 0.28 at ~0.05 cycles/day (20 day period) 95%
Tropical West Pacific AverageSquared CoherenceBetween Buoys and 4 Analyses: 10 buoy locations • OSTIA drops below 0.28 at ~0.2 cycles/day (5 day period) • Daily OI drop below 0.28 at ~0.1 cycles/day (10 day period) • Other analyses drop below 0.28 at ~0.05 cycles/day (20 day period) 95%
Buoy vs. Satellite Data in OI • Buoy: Point measurement, good daily average • Satellite: Spatial average, good snapshot S S S S S S S S S S S S B/S S S S S S S S S S S S S
N. American West Coast Average Squared CoherenceBetween Buoys and 4 Analyses: 22 buoy locations • OSTIA drops below 0.28 slightly at ~0.45 cycles/day • Daily OI drop below 0.28 at ~0.2 cycles/day (5 day period) • Other analyses drop below 0.28 at ~0.1 cycles/day (10 day period) 95%
Spectral – Results - 1 • Squared Coherence between buoys and analyses drops below 0.28 at frequencies greater than ~ 0.2 cycles/day (5 day period) • May be due to difference between spatial point value (buoy data) and spatial average (satellite data/analysis) & satellite spatial coverage
Spectral – Results - 2 • In the tropics RSS has too much variability compared to buoys at middle and high frequencies • To fix RSS more smoothing needed, for example • Wider time window • Temporal damping when no new observations available • Longer spatial e-folding scales