Download
1 / 14
140 likes | 256 Views
A High-Resolution X-ray Spectral Analysis of DoAr 21. Martin Mudd (Williams College) KNAC 2003 Advisors: David Cohen & Eric Jensen Partner: Victoria Swisher Swarthmore College. Introduction. X-ray production in T Tauri stars. Young stellar objects (YSOs) are X-ray bright

E N D
A High-Resolution X-ray Spectral Analysis of DoAr 21 Martin Mudd (Williams College) KNAC 2003 Advisors: David Cohen & Eric Jensen Partner: Victoria Swisher Swarthmore College
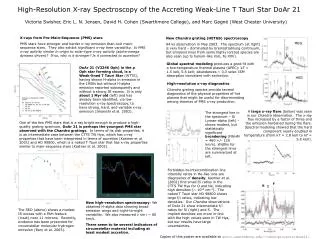
Introduction X-ray production in T Tauri stars • Young stellar objects (YSOs) are X-ray bright • Several models for X-ray production • Accretion streams • Magnetic confinement of plasma (by stellar dynamo fields) (c) High resolution studies can help constrain the properties of the emission mechanism.
T Tauri Stars • T Tauri stars (TTS) are young stellar objects in the middle of their evolution from protostars to the zero-age main sequence. • Two classes of T Tauri stars • Classical (cTTS): have thick accretion disks. • Weak-lined (wTTS): have very thin accretion disks, if any. DoAr 21: an X-ray bright TTS Dolidze and Arakelyan (1959) DoAr 21 is the most X-ray bright star in the region Oph Stellar type K1V It is a weak-lined T Tauri, i.e. it may have a very thin disk.
Observation Information We received data from the Chandra X-ray Telescope’s high energy (HEG) and medium energy (MEG) gratings. The exposure was approximately 90 ks in duration. To avoid systematic errors we checked the + and - spectra around the zeroth order to make sure it was correctly calibrated by the pipeline. The resulting spectra are actually quite noisy. A significant flare occurred during the observation.
Procedures Spectral line fitting Thermal model fitting Time splitting Spectral Line Fitting Label each discernible line with its ion name and note the helium-like triplets. Fit each line to a Gaussian+poly, record parameters. (position, FWHM, normalized amplitude) Calculate Doppler broadening and line ratio diagnostics.
Doppler Broadening FWHM represents the range of blueshift and redshift from center wavelength due to high velocity plasma in our line of sight. X-ray spectra from accretion-infall emission often have significantly broadened lines. Line Ratio Diagnostics • The amplitude data measures how strong the emission is. • There are several line-ratios for He-like triplets from C&J • F/I ratio = forbidden / intercombination • (F+I)/R = (forbidden+intercombination) / resonance • H-like/He-like
Line Ratio Diagnostics • These are useful for constraining temperature and density in collision-dominated plasmas: • F/I is a function of electron density. • (F+I)/R is a function of electron temperature. • So is H-like/He-like • These relationships are due to a complex balance of thermodynamic interactions of ions in a plasma. • Fe XXII special diagnostics are not reliable here.
Thermal Model Fitting • Use the Sherpa software to fit thermal plasma models • regular models: (APEC, MEKAL) • variable abundance models: (VAPEC, VMEKAL) • diff. emission measure (DEM) models: (XSC6) • Assess goodness-of-fit for each model: calculate the ratio of the integrated model curve to that of the data over a specified wavelength range for each strong line. If the fit is good, average of these ratios should be close to 1. • Find the best model. The parameters for this fit will be the most accurate constraints on the properties of the X-ray emitting plasma.
Time Splitting Properties may change during a flare. (Emission sure does.) So we should look at each phase individually. This part is easy: just separate the full data set into partitions based on our light curve and the criteria for quiescent and flare phases from Imanishi et al. Here’s the hard (annoying) part: now analyze each of these partitions in the same way as for the full data set, then compare the results. The splitting is done, the analysis of each phase remains as future work.
Results: line ratios Few lines show Doppler broadening No strong constraints from line-ratio diagnostics. R(Si XIII) = (F/I) = 2.6 ± 1.1 However, we do see an upper bound on density: ~ 1.6 ·1013 cm-3
Results: thermal model parameters • Temperatures: (1 keV = 11.6 million degrees Kelvin) • kT1 = 1.51 keV • kT2 = 5.20 • kT3 = 5.30 • Abundances: Fe: 0.16 * solar abundance
Conclusions • Low signal-to-noise means harder to fit accurately. Therefore, these constraints are not perfect, but they are the best currently available. • Further work includes: • Compute higher-temperature curves for the (F+I)/R line ratios • Repeat this analysis for the quiescent and flare phases.
Acknowledgments • Keck Northeast Astronomy Consortium for the opportunity • K. Kwitter for suggesting the internship. • D. Cohen & E. Jensen for excellent guidance and an enjoyable summer of research. • V. Swisher for really doing most of the work. • M. Gagne and M. Brown for interesting discussions on ion line ratios and stellar dynamos.