Download
1 / 26
260 likes | 267 Views
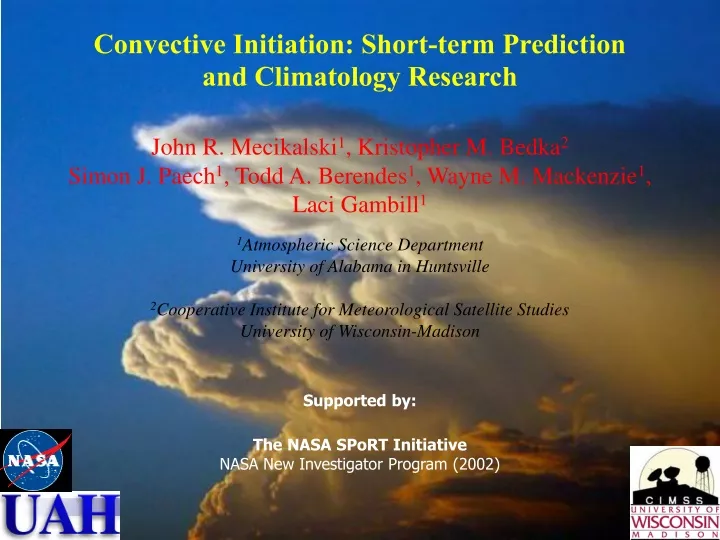
Convective Initiation: Short-term Prediction and Climatology Research John R. Mecikalski 1 , Kristopher M. Bedka 2 Simon J. Paech 1 , Todd A. Berendes 1 , Wayne M. Mackenzie 1 , Laci Gambill 1 1 Atmospheric Science Department University of Alabama in Huntsville

E N D
Convective Initiation: Short-term Prediction and Climatology Research John R. Mecikalski1, Kristopher M. Bedka2 Simon J. Paech1, Todd A. Berendes1, Wayne M. Mackenzie1, Laci Gambill1 1Atmospheric Science Department University of Alabama in Huntsville 2Cooperative Institute for Meteorological Satellite Studies University of Wisconsin-Madison Supported by: The NASA SPoRT Initiative NASA New Investigator Program (2002)
Overview: UAH Contributions • Diagnostics: ALEXI land-surface (So, Aw, Rnet, ET) fields, ADAS surface Ta. All at 2-10 km resolution. Aviation Safety. • Nowcasting (0-6 h): Convective initiation (CI), Lightning Initiation & First Lightning; “CI Index” for 2-6 h CI (based on satellite & NWP model fields). Aviation Safety (ASAP). • Short-term Prediction (6-24 h): Utilize “diagnostics” as satellite-based boundary conditions, ADAS populated by remote sensing data (satellite & radar) toward a high-resolution (5-10 km) regional initialization for ARPS, WRF, etc. • UAH Graduate students: NWS SCEP, MS/Ph.D. studies that involve NWS interactions. Developing “in-house” nowcasting expertise.
Overview: UAH Contributions • Diagnostics: ALEXI land-surface (So, Aw, Rnet, ET) fields, ADAS surface Ta. All at 2-10 km resolution. • Nowcasting (0-6 h): Convective initiation (CI), Lightning Initiation & First Lightning; “CI Index” for 2-6 h CI (based on satellite & NWP model fields). Aviation Safety (ASAP). • Short-term Prediction (6-24 h): Utilize “diagnostics” as satellite-based boundary conditions, ADAS populated by remote sensing data (satellite & radar) toward a high-resolution (5-10 km) regional initialization for ARPS, WRF, etc. • UAH Graduate students: NWS SCEP, MS/Ph.D. studies that involve NWS interactions. Developing “in-house” nowcasting expertise.
Outline • Current capability: Overview • Background Error assessments • Confidence analysis • Incorporation of MODIS information • Current & new initiatives for SPoRT in 2006 • NWS transition and assessment • Nighttime CI forecasting • Lightning (event) forecasting
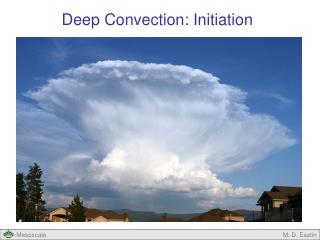
How this began… • • • Which cumulus will become a thunderstorm? • GEO satellite seems to be well-suited to address this question. • What methods are available? • What changes to current, globally-developed codes are needed? • Who can benefit from this research? • What user groups are interested (e.g., 0-2 h nowcasting)
Where are we now … • Applying CI algorithm over U.S., Central America & Caribbean • Validation & Confidence analysis • Satellite CI climatologies/CI Index: 1-6 h • Work with new instruments • Data assimilation possibilities
Input Datasets for Convective Nowcasts/Diagnoses • Build relationships between GOES and NWS WSR-88D imagery: • Identified GOES IR TBand multi-spectral technique thresholds and time trends present before convective storms begin to precipitate • Leveraged upon documented satellite studies of convection/cirrus clouds [Ackerman (1996),Schmetz et al. (1997), Roberts and Rutledge (2003)] • After pre-CI signatures are established, test on other independent cases to assess algorithm performance Use McIDAS to acquire data, generally NOT for processing: • GOES-12 1 km visible and 4-8 km infrared imagery every 15 minutes • UW-CIMSS visible/IR “Mesoscale” Atmospheric Motion Vectors (AMVs) • WSR-88D base reflectivity mosaic used for real-time validation • NWP model temperature data for AMV assignment to cumulus cloud pixels … based on relationship between NWP temp profile and cumulus 10.7 m TB • Other non-McIDAS data: • UAH Convective Cloud Mask to identify locations of cumulus clouds
Convective Cloud Mask • Foundation of the CI nowcast algorithm: Calculate IR fields only where cumulus are present (10-30% of a domain) • Utilizes a multispectral and textural region clustering technique for classifying all scene types (land, water, stratus/fog, cumulus, cirrus) in a GOES image • Identifies 5 types of convectively-induced clouds: low cumulus, mid-level cumulus,deep cumulus,thick cirrus ice cloud/cumulonimbus tops,thin cirrus anvil ice cloud
50% shown “Mesoscale” Atmospheric Motion Vector Algorithm “Operational Settings” New Mesoscale AMVs (only 20% shown) • We can combine mesoscale AMV’s with sequences of 10.7 m TB imagery to identify growing convective clouds, which represent a hazard to the aviation community
CI Interest Fields for CI Nowcasting from Roberts and Rutledge (2003)
2030 UTC 2100 UTC CI Nowcast Algorithm: 4 May 2003 2000 UTC CI Nowcast Pixels These are 1 hour forecasted CI locations! • Satellite-based CI indicators provided 30-45 min advanced notice of CI in E. and N. Central Kansas. • PODs ~50% at 1 km (FARs ~40%) • NEW Linear Discriminant Analysis methods provide ~65% POD scores for 1-hour convective initiation.
An Example over the Tropics: CI • An example of the CI nowcasting method over Central America: • Real-time • Every 30 min during the day (nighttime coming soon) • GOES (MODIS soon) • RED/GREEN pixels have highest CI probability
CI “Interest Fields”: 8-GOES 2-MODIS 8.5-10.7 m (MODIS) > 0° C 8.5-10.7 m (MODIS) > 0° C
“Interest Field” Importance: POD/FAR > 0° C 8.5-10.7 m (MODIS) > 0° C 8.5-10.7 m (MODIS) • Instantaneous 13.3–10.7 um:Highest POD (84%) • Time-trend 13.3–10.7 um:Lowest FAR (as low as 38%) • Important for CI & Lightning Initiation
The lower right shows the supercooled water in green. • Proof of concept for determining the difference between supercooled water and glaciated towering cumulus clouds.
CI/LI Linear Discriminant Analysis (LDA) • Remap GOES data to 1 km gridded radar reflectivity data • Correct for parallax effect by obtaining cloud height through matching the 10.7 m TB to standard atmospheric T profile • Identify radar/lightning pixels that have undergone CI/LI at t+30 mins • Advect pixels forward using low-level satellite wind field to find their approximate location 30 mins later • Determine what has occurred between imagery at time t, t-15, & t-30 mins to force CI/LI to occur in the future (t+30 mins) • Collect database of IR interest fields (IFs) for these CI/LI pixels • Apply LDA: identify relative contribution of each IF toward an accurate nowcast • Test LDA equation on • independent cases to • assess skill of new method ddddddddddddddddddddddd
CI/LI Linear Discriminant Analysis (LDA) • Improved POD of ~65% and FAR of ~34% • A virtual-radar from satellite
Outline • Current capability: Overview • Background Error assessments • Confidence analysis • Incorporation of MODIS information • Current & new initiatives for SPoRT in 2006 • NWS transition and assessment • Nighttime CI forecasting • Lightning (event) forecasting
Detecting Convective Initiation at Night • Detection of convective initiation at night must address several • unique issues: • Restricted to 4 km data (unless MODIS is relied upon) • Visible data cannot be used to formulate cumulus mask • Highly-dense, GOES visible winds are unavailable for tracking • Forcing for convection often elevated and difficult to detect (e.g., low-level jets, bores, elevated boundaries) However, the advantages are: a) Ability to use ~3.9 m channel (near-infrared) data (!!!) b) More “interest fields” become available for assessing cumulus cloud development Therefore, new work is toward expanding CI detection for nocturnal conditions, and/or where lower resolution may be preferred (i.e. over large oceanic regions). Wayne Mackenzie, MS student
Detecting Convective Initiation at Night Nighttime CI: Southeast Oklahoma SHV: 2:57 - 3:44 UTC Enhanced 10.7 m
6.5-3.9 m 13.3-3.9 m Detecting Convective Initiation at Night What we’ve learned so far: 10.7-3.9 m channel difference (Ellrod “fog” product) Evaluation is being done in light of the forcing for the convection (e.g., low-level jets, QG).
Satellite-Lightning Relationships • Current Work: Develop relationships between IR TB/TB trends and lightning source counts/flash densities toward nowcasting (0-2 hr) future lightning occurrence • * Supported by the NASA New Investigator Program Award #:NAG5-12536 Northern Alabama LMA Lightning Source Counts 2040-2050 UTC 2047 UTC 2147 UTC 2140-2150 UTC kkoooooooookkkkkkkkkkk
Transition Activities • NWSFO Huntsville (May 2005) • NOAA WWB (September 2005) • FAA AWRP (Spring 2005) • FAA MIT-LL (now) AWIPS
Nowcasting plans for 2006 Theme 1: Formal NWS evaluation of 0-1 hour CI product (that has been pushed to NWS Huntsville since May 2005). Theme 2:First efforts at 30-min to 1.5 hour lightning initiation nowcasting. Theme 3:Formation of “CI Index” that is based on Climatology of CI fields over Southeastern U.S., NWSFO region, etc. Theme 4:First developments of assimilation of “boundaries” as defined by CI fields.
Contact Information/Publications • Contact Info: • Prof. John Mecikalski: johnm@nsstc.uah.edu • Kristopher Bedka: krisb@ssec.wisc.edu • Web Pages: • nsstc.uah.edu/johnm/ci_home (biscayne.ssec.wisc.edu/~johnm/CI_home/) • http://www.ssec.wisc.edu/asap • Publications: • Mecikalski, J. R. and K. M. Bedka, 2006: Forecasting convective initiation by monitoring the evolution of moving cumulus in daytime GOES imagery. In Press.Mon. Wea. Rev. (IHOP Special Issue, January 2006). • Bedka, K. M. and J. R. Mecikalski, 2005: Applications of satellite-derived atmospheric motion vectors for estimating mesoscale flows. J. Appl. Meteor. 44, 1761-1772. • Mecikalski, J. R., K. M. Bedka, and S. J. Paech, 2005: A statistical evaluation of GOES cloud-top properties for predicting convective initiation. In preparation. Mon. Wea. Rev. • 6-conference talks/posters in 2005/06