Download
1 / 84
840 likes | 859 Views
Mean, Variability, and the Most Predictable Patterns in CFS over the Tropical Atlantic Ocean Zeng-Zhen Hu 1 Bohua Huang 1,2 (Contributors: K. Pegion and B. Jha) ( Acknowledgments: S. Saha, S. Yang, K. Campana) 1 Center for Ocean-Land-Atmosphere Studies Calverton, Maryland, USA

E N D
Mean, Variability, and the Most Predictable Patterns in CFS over the Tropical Atlantic Ocean Zeng-Zhen Hu1 Bohua Huang1,2 (Contributors: K. Pegion and B. Jha) (Acknowledgments: S. Saha, S. Yang, K. Campana) 1Center for Ocean-Land-Atmosphere Studies Calverton, Maryland, USA 2Department of Atmospheric, Oceanic, and Earth Sciences, College of Science George Mason University, Fairfax, Virginia, USA COLA COLA & NCEP CTB Joint Seminar: NCEP, Dec. 10, 2007
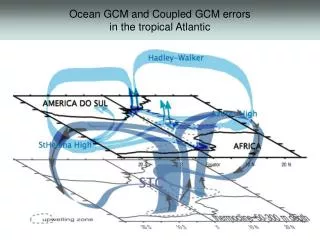
Why study Atlantic climate of CFS? Atlantic Ocean is very important to US and European (even global) climate. Hurricanes, Heat Waves, Meridional Overturning Circulation (MOC), North Atlantic Oscillation. CFS is the operational model in US to do the seasonal climate prediction We are the Atlantic research group at COLA and supported by NOAA Atlantic project. There are less published works of NCEP CFS about Atlantic than about Pacific.
Main topics:Part 1: What is the ability of CFS in simulating the mean climate in the tropical Atlantic? What is the possible role of the cloud-radiation-SST feedback in the biases? Part 2: What is the ability of CFS in simulating the leading variability modes and the associated physical processes in the tropical Atlantic? Part 3: What is the predictive skill and most predictable patterns of CFS in the tropical Atlantic Ocean? What is their connection with ENSO ?
CFS Free Run AGCM: NCEP T62&L64 OGCM: MOM3, 1/3o(10oS-10oN), 1o(higher latitudes); 74oS-64oN, L40 Free run: Jan 1985-Dec 2036, conducted by Kathy Pegion at COLA CFS Hindcasts: All calender months: Jan. 1981-Dec. 2003 15 predictions of 9 month length from lead month 0 to 8 Oceanic ICs: 11th, 21st of month 0, 1st of month 1 (Saha et al. 2006; Huang and Hu 2006). The atmospheric IC: the NCEP reanalysis II (Kanamitsu et al., 2002). Same day & those within two days before and after Data available from http://nomad6.ncep.noaa.gov/cfs/monthly AGCM: NCEP T62&L64 OGCM: MOM3, 1/3o(10oS-10oN), 1o(higher latitudes); 74oS-64oN, L40 Observations NCEP/NCAR reanalysis I (Kalnay et al. 1996); ERA40 (Uppala et al. 2005) Cloud coverage data by ISCCP on 2.5ox2.5o, Jul1983-Dec2004 (Rossow and Dueñas 2004); Corresponding radiation calculated by Zhang et al. (2004) The SST dataset is the extended reconstruction (ER-v2) on 2ox2o (Reynolds et al. 2002) NCEP Global Ocean Data Assimilation (GODAS) (Behringer et al. 1998; Behringer and Xue 2004) Data & CFS
Part 1: Mean Biases & the Role of Cloud-Radiation-SST Feedback Hu, Z.-Z., B. Huang, and K. Pegion, 2008: Leading patterns of tropical Atlantic variability in a coupled GCM.Climate Dynamics, 30 (7-8), 703-726, DOI 10.1007/s00382-007-0318-x. Hu, Z.-Z., B. Huang, and K. Pegion, 2007: Low cloud errors over the southeastern tropical Atlantic in the NCEP CFS and their association with lower-tropospheric stability and air-sea interaction.JGR-Atmo. 113, D12114, doi:10.1029/2007JD009514.
Seasonal Mean and Variance of SST:(1) General pattern and zonal gradient well simulated(2) Warm bias(3) Too small variance in southeastern Ocean
CFS Simulation of Tropical Atlantic SST Climatology Mean Field Equatorial SST (Gradient) CFS CFS OBS OBS OBS DJF MAM CFS OBS Annual CFS CFS CFS OBS JJA SON OBS
For majority of current CGCMs, it is still a challenge in simulating the zonal SST gradient along equatorial Atlantic(Davey et al. 2002) No Flux Correction With Flux Correction
Observed and CCSM Simulated JJA SST(Deser et al. 2006: J. Climate, 19, 2451-2481)
Observed and CCSM3 Simulated MAM SST(Deser et al. 2006: J. Climate, 19, 2451-2481)
Compared with other coupled models (CCSM, MPI, ECMWF, MO, and others), CFS did very good job in the tropical Atlantic, particularly in simulating the equatorial SST gradient. However, most of these CGCMs show a similar error pattern in the tropical Atlantic: warm bias in the southeastern Ocean.
CFS Systematic Biases (CFS-ISCCP//ERv2) MAM There are coherent biases in the southeastern Atlantic Ocean: (1) Too few low clouds(2) Too much short-wave radiation reaching the sea surface (3) Warm biases JJA SON DJF Low Clouds Short-Wave SST
Do the differences of cloud definition between the CFS and ISCCP affect the results of the comparison?The answer is “YES orNO”.
Difference of the Cloud Definition ISCCP: Low clouds is accounted only in regions without being covered by higher clouds(underestimated)CFS: Low clouds=BL+low clouds(overestimated)SO: CFS-ISCCP: underestimate the amplitudes of negative differences;overestimate the positive ones
JJA Low Clouds & Vertical T Gradient T700-T850 St. Helena Radiosonde Station Low Clouds B A T850-T925 CFS: Region A OBS: Region B
Low Clouds & Vertical T Gradient Quasi-inversion layer NO quasi-inversion layer T700-T850 Inversion layer NO inversion layer T850-T925 CFS Region A OBS Region B Low Clouds
CFS Has More High Clouds than in ISCCPThe Atmosphere is more Stable in Real World than in CFS Region A Region B <5% <10% T700-T850 BLCloud Amount <30% <30% T850-T925 CFS ISCCP CFS ISCCP
Also low clouds may be associated with different climate modes:CFS: Subtropical South Atlantic Mode (SSA)OBS: Southern Tropical Atlantic Mode (STA) or Zonal Mode/Atlantic Nino UV & SST Regression onto Low Clouds in region B CFS OBS
There are also some errors in the seasonal cycle:(1) Along Equator: 1 month delay of seasonal transitionOverestimated variability(2) In the tropical South Atlantic:Without westward propagationSoutherly wind errors
Monthly-Annual Mean of SST& Wind Stress along Equator CFS: one month delayed transition similar wind stress Related to the Difference of African Monsoon ? Overestimated: STA mode
Monthly-Annual Mean of SST& Wind Stress along 15˚S No propagation Westward propagation STA Mode Warm Bias: African Monsoon &tropical transition?
Summary of Part 1: Mean & the Role of Cloud-Radiation-SST Feedback in the Biases • The seasonal mean climate is well simulated; SST zonal gradient along the equator is qualitatively correct in the CFS. However, there are warm SST biases and reduced variability in the southeastern Ocean. The annual cycle of SST along the equator is delayed by one month. Westward propagation of SST along 15oS is not seen in the CFS • CFS: Deficit low-cloud and excessive SW radiation can cause the warm SST bias in the southeastern Atlantic. In return, the warm bias does not favor inversion layer and also more low-clouds. CFS can not correctly simulate the vertical inversion layer of the temperature and the formation of low cloud. Low-cloud formation: Observed: (T850-T925); CFS: (T700-T850) • There are much more high clouds in CFS than in ISCCP. The atmosphere is more unstable in CFS than in the real world • The variability of wind stress and heat flux is too small in the southeastern Atlantic.There are double ITCZ in MAM and DJF, and too much precipitation in the western tropical Atlantic
Part 2: Leading Variability Patterns and the Associated Physical Processes in the Tropical Atlantic Ocean Hu, Z.-Z., B. Huang, and K. Pegion, 2008: Leading patterns of tropical Atlantic variability in a coupled GCM.Climate Dynamics,30 (7-8), 703-726, DOI 10.1007/s00382-007-0318-x.
CFS Well Simulates Leading Modes STA NTA SSA ER-v2 1st 16% 3rd 10% 2nd 15% CFS 3rd 10% 2nd 11% 1st 12%
Power Spectrum of Leading Modes 2.3, 1.5, 1.05 years 3.0, 1.5 0.75 years STA 4.0, 0.8 0.5 years 2.4, 1.1, 0.5 years NTA 5.5, 1.45, 1.0, 0.65 years 5.0, 1.2 years SSA ER-v2 CFS
Seasonality (Variance) of the Leading Modes STA NTA SSA ER-v2 CFS
CFS/ER-v2 Links with ENSO not similar STA similar NTA wrong SSA ENSO Leading ENSO Lagging
Associated downward net HFSTA: thermodynamic damping & dynamic processes (similar to ENSO)NTA: thermodynamic processes &WESSSA: thermodynamic processes & WES & northwest shift STA NTA SSA NCEP/NCAR CFS
STA:Lead-Lag Correlation of ATL3 (3oS-3oN, 0-20oW)with SST, HC & Wind Stress Along Equator(10 YR HF) SST&UV ATL3 Leading SST&UV ATL3 Lagging ATL3 Leading HC HC ATL3 Lagging OBS: CFS
MAM NTA: Total (NAO/AO) NTA Patterns in MAM OBS CFS Asymmetric: Tropical Pacific OBS CFS
DJF SSA: Total: AAO SSA pattern in DJF OBS CFS Asymmetric: Tropical Pacific (Mo et al.) NW shift OBS SHIFT CFS
Summary of Part 2: Leading Variability Patterns and the Associated Physical Processes • The leading variability modes, their associated physical processes are reasonable well reproduced. • STA associated anomalies are too strong in the CFS • SSA and NTA are associated with similar physical processes in their hemispheres: zonal component (AO/NAO; AAO), zonal asymmetric variability (tropical Pacific Ocean) • The shift may be associated with teleconnection difference • The frequency feature of the leading variability modes and their links with ENSO, as well as the seasonality are similar/different between CFS and observations/reanalyses • Overall, the simulation of NTA is better than that of STA and SSA, which may be due to the fact that the ENSO influence is (not) correctly simulated in tropical N. (S.) Atlantic in CFS
Part 3: What are Predictive Skills, Most Predictable Patterns and the Influence of ENSO ? Hu, Z.-Z. and B. Huang, 2007: The predictive skill and the most predictable pattern in the tropical Atlantic: The effect of ENSO. Mon. Wea. Rev., 135, 1786-1806.
SST Predictive Skill: Anomalous Corr. Coefficient Lead 1 Lead 3 Lead 5 Lead 7 CFS Hindcast Persistence CFS Minus Persistence
*TB is the best and Dipole is the worst, NB and SB are in between*prediction with IC from JJA&SON is more accurate than that from MAM JJA&SON MAM
What are the most predictable patterns of SST, H200, and precipitation inMarch? Why choose March as target month? � High predictive skill in CFS (previous figure) �Large variability (Nobre and Shukla 1996) � Strong connection between TAV & ENSO (Tourre & White 2005) � However, the general patterns are similar for different targeted months Maximized signal-to-noise EOF is used to identify the most predictable pattern (MSN PC: orthogonal; EOF: not orthogonal)
MSN EOF1 SST & ENSO(the observation & predictions; Nov. IC & 4 month lead) ER-v2 SST CFS SST
MSN EOF1 of H200:A basin wide coherent variation symmetric about the equator Nino3.4 & H200
MSN EOF1 of precipitation:Contrary variation of e. tropical Pacific and the tropical land
Maximum Signal-to-Noise EOF1 (CFS Hindcast SST) March Forecast: at 4-months Lead OBS Correlation with MSN EOF1 CFS SST H200
Theory of Chiang & Sobel (2002):The existence of atmosphere convection is crucial for temperature variations to propagate from troposphere to surface 12-8OS temperature regression onto MSN EOF1 of precipitation OBS X CFS Warm Bias
Summary of Part 3: Predictive Skills, Most Predictable Patterns and the Influence of ENSO(1) There are reasonable predictive skills over the tropical Atlantic. The skill is higher in the tropical North Atlantic than in the tropical South Atlantic, with IC in JJA&SON than in MAM(2) The skills and the most predictable pattern are largely attributed to the influence of ENSO in the tropical Atlantic Ocean
Summary • MEAN: The seasonal mean climate is well simulated. There are warm SST biases and suppressed variability in the southeastern ocean. Deficit low-cloud and excessive SW radiation are associated with the warm SST bias in the southeastern Atlantic. In return, the warm biases do not favor inversion layer. CFS can not correctly simulate the vertical inversion layer of the temperature and the formation of low cloud. Low-cloud formation: Observed: (T850-T925); CFS: (T700-T850). There are much more high clouds in CFS than in ISCCP.The atmosphere in the tropical Atlantic is more stable in the real world than in CFS. • MODES: The leading variability modes, their associated physical processes, as well as the seasonality are well reproduced. The frequency feature and the association with ENSO are partly simulated.STA associated anomalies are too strong in the CFS;SSA and NTA are associated with similar physical processes in their hemispheres: zonal component (AO/NAO; AAO), zonal asymmetric variability (tropical Pacific Ocean). The shift of SSA may be due to the teleconnection difference. Overall, N. Atlantic is better simulated than S. Atlantic • PREDICTION: The predictive skill depends on region and initial condition month.The skill is higher in N. Atlantic than in S. Atlantic, and with IC in JJA&SON than in MAM. The predictive skill and most predictable pattern are associated with the influence of ENSO.The unrealistic part of the most predictable pattern of SST in the SE Atlantic is partly caused by the biases.
Related Publications Hu, Z.-Z., B. Huang, and K. Pegion, 2008: Leading patterns of tropical Atlantic variability in a coupled GCM. Climate Dynamics,30 (7-8), 703-726, DOI 10.1007/s00382-007-0318-x. Hu, Z.-Z., B. Huang, and K. Pegion, 2008: Low-cloud errors over the southeastern tropical Atlantic Ocean in the NCEP CFS and the association with lower tropospheric instability and air-sea interaction. JGR-Atmos, 113, D12114, doi: 10.1029/2007JD009514. Hu, Z.-Z., B. Huang, and K. Pegion, 2009: Biases and the most predictable patterns in the NCEP CFS over the tropical Atlantic Ocean. The Atlantic Ocean: New Oceanographic Research, Nova Science Publishers, Inc., New York, USA. Hu, Z.-Z. and B. Huang, 2007: The predictive skill and the most predictable pattern in the tropical Atlantic: The effect of ENSO. Mon. Wea. Rev. 135, 1786-1806. Comments or Ask reprints/PDF files, send e-mail to Hu@cola.iges.org
Future Work:In cooperation with CFS experts, do some sensitive experiments by specifying low clouds in the model to explore the impact of low clouds on the CFS biases in the tropical oceans
What is the Maximized Signal-to-Noise EOF (I) • The MSN EOF is a method to derive patterns that optimize the signal-to-noise ratio from all ensemble members. • This approach was developed by Allen and Smith (1997) and has been used in Venzke et al. (1999), Sutton et al. (2000), Chang et al. (2000), and Huang (2004). • An ensemble mean is supposedly including a forced and a random part, which may be attributed respectively to the prescribed external boundary conditions and the unpredictable internal noise. In our case, the forced part is associated with the predictable signals which show certain consistency among different members of the ensemble predictions. • The leading MSN EOF mode is the one with the maximum ratio of the variance of the ensemble mean to the deviations among the ensemble members. • In this work, we only analyze the leading MSN EOF mode, which is defined as the most predictable pattern and is significant at the 95% level using a F-test. • Details of this method were documented in Allen and Smith (1997), Venzke et al. (1999), and Huang (2004).
Variable: Xensemble =Xforced+ Xrandom Covariance: Censemble =Cforced+ Crandom (If Xforcedand Xrandom are temporally uncorrelated) Crandom= Cnoise/15 (Cnoiseis the average noise covariance of the 15 ensemble members To find the eigenvector of Cforced, the key procedures is to eliminate the spatial covariance of the noise. Which is equivalent to a transformation F such that FT CrandomF= I The transformation guarantees that FT CforcedF and FT CensembleF have identical eigenvalues. F is estimated from the first K weighted EOF patterns of the deviations X’i =Xi-Xensemble(i denotes the ith member within the ensemble). The matrix of eigenvectors (E) of FT CensembleF contains a set of optimal noise filters, which can be restored into physical space by É=FE. The optimal filter (the 1st column vector é= É) maximizes the ratio of the variances of the ensemble mean and within-ensemble deviations (Venzke et al., 1999). The optimally filtered time series of Xensemble (i.e., its projection onto é) gives the 1st MSN principal component (PC). In practice, one can simply first project Xensemble onto F to form the pre-whitened data in the noise EOF space and then conduct an SVD to get both E and all MSN PCs simultaneously (Huang 2004). The 1st MSN EOF pattern, which represents the dominant spatial response, is derived by projecting Xensemble onto the 1st MSN PC. MSN EOF (II)