Download
1 / 19
190 likes | 192 Views
This study analyzes the biases in the NCEP CFS model and investigates the multi-time scale variability in the tropical Atlantic using satellite observations. It evaluates the biases in cloud coverage, short-wave radiation, and sea surface temperature, and examines the connection between low clouds and different climate modes.

E N D
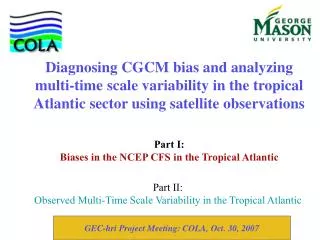
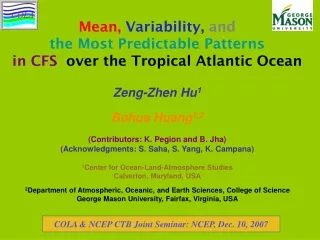
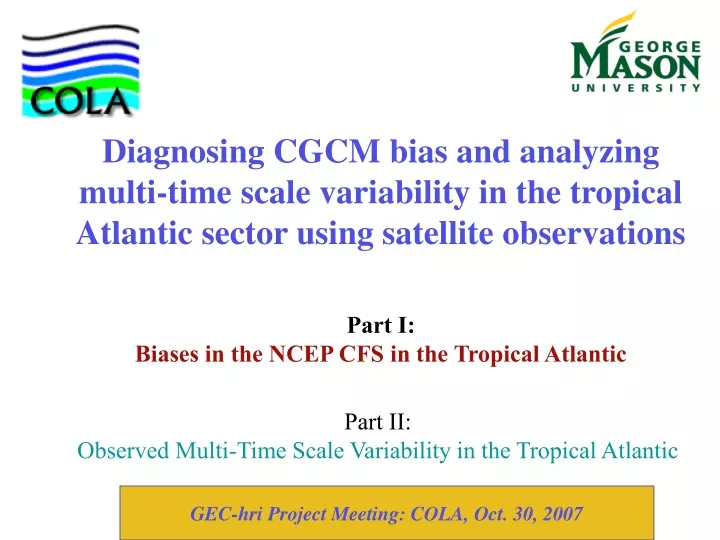
Part II:Observed Multi-Time Scale Variability in the Tropical Atlantic Diagnosing CGCM bias and analyzing multi-time scale variability in the tropical Atlantic sector using satellite observations Part I: Biases in the NCEP CFS in the Tropical Atlantic GEC-hri Project Meeting: COLA, Oct. 30, 2007
Part I: Biases in the NCEP CFS in the Tropical Atlantic Note: Since the GEOS5 is not running at COLA yet, here we have used CFS as an example. We plan to look into GEOS5 in the same way as we have done for CFS. Zeng-Zhen Hu (COLA) Bohua Huang (GMU & COLA) Kathy Pegion (COLA)
CFS Model& Simulations AGCM: NCEP T62&L64 OGCM: MOM3, 1/3o(10oS-10oN), 1o(higher latitudes); 74oS-64oN, L40 Free run: Jan 1985-Dec 2036 Observations NCEP/NCAR reanalysis I (Kalnay et al. 1996); ERA40 (Uppala et al. 2005) Cloud coverage data by ISCCP on 2.5ox2.5o, Jul1983-Dec2004 (Rossow and Dueñas 2004); Corresponding radiation calculated by Zhang et al. (2004) The SST dataset is the extended reconstruction (ER-v2) on 2ox2o (Smith and Reynolds 2003) Data & CFS
CFS Well Simulates Leading Modes STA NTA SSA ER-v2 1st 16% 3rd 10% 2nd 15% STA NTA SSA CFS 3rd 10% 2nd 11% 1st 12%
CFS Systematic Biases MAM There are coherent biases in the southeastern Atlantic Ocean: (1) Too few low clouds(2) Too much short-wave radiation reaching the sea surface (3) Warm biases JJA SON DJF Low Clouds Short-Wave SST
JJA Low Clouds & Vertical T Gradient T700-T850 Low Clouds B A T850-T925 CFS: Region A OBS: Region B
Low Clouds & Vertical T Gradient Quasi-inversion layer NO quasi-inversion layer T700-T850 Inversion layer NO inversion layer T850-T925 CFS Region A OBS Region B Low Clouds
Regression: Low Clouds in region B &UV+SST Also low clouds may be associated with different climate modes:CFS: Subtropical South Atlantic Mode (SSA)OBS: Atlantic Niño/Southern Tropical Atlantic Mode (STA) or Zonal Mode CFS OBS
Summary of Part I: Biases in the NCEP CFS in the tropical Atlantic • CFS: Deficit low-cloud and excessive SW radiation can cause the warm SST bias in the southeastern Atlantic. In return, the warm bias does not favor inversion layer and also low-cloud formation. • CFS can not correctly simulate the vertical inversion layer of the temperature and the formation of low cloud. Low-cloud formation: Observed: (T850-T925); CFS: (T700-T850)
Publications(partly supported by this project and a NOAA project) • Hu, Z.-Z., B. Huang, and K. Pegion, 2007: Low cloud errors over the southeastern Atlantic in the NCEP CFS and their association with lower-tropospheric stability and air-sea interaction. J. Geophys. Res. (atmosphere), (submitted). • Hu, Z.-Z., B. Huang, and K. Pegion, 2007: Leading patterns of the tropical Atlantic variability in a coupled GCM. Climate Dynamics, DOI 10.1007/s00382-007-0318-x.
Part II:Observed Multi-Time Scale Variability in the Tropical Atlantic Bohua Huang (GMU & COLA) Zeng-Zhen Hu (COLA)
Connection of the Tropical Oceans at 25-80 Day time Scales _ + +
Summary of Part II: Observed Multi-Time Scale Variability in the Tropical Atlantic • There are multi-time scale variability in the tropical Atlantic Ocean. • The variability at 25-80 day time scales in the tropical Atlantic is a part of intra-seasonal variability of global tropical oceans. There is a clear connection between global tropics and tropical Atlantic: out-of-phase: the tropical western Pacific; in-phase:Indian Oceans. • The variability in the atmosphere is weakly coupled with SST.
ISCCP (Weare 1999; Rossow&Dueñas 2004) CFS (Xu&Randall 1996) Clouds in ISCCP & CFS ISCCP CFS High High Middle (350-650hPa) Middle (400-680 hPa) Unstable & convective clouds Stable & stratus clouds Low (650-900hPa) Low (680-surface) BL (>900hPa)