Download
1 / 10
100 likes | 222 Views
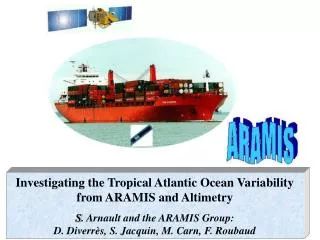
Variability of fCO 2 in the tropical and North Atlantic Ocean Nathalie Lefèvre, Denis Diverrès, Francis Gallois. VOS lines in CARBOOCEAN. Biogeochemical provinces sampled by the two VOS lines. NAST(E): North Atlantic Subtropical Gyre (East) Westerlies domain

E N D
Variability of fCO2 in the tropical and North Atlantic Ocean Nathalie Lefèvre, Denis Diverrès, Francis Gallois
Biogeochemical provinces sampled by the two VOS lines • NAST(E): North Atlantic Subtropical Gyre (East) • Westerlies domain • NATR: North Atlantic Tropical Gyre • trade winds domain WTRA: Western Tropical Atlantic • trade winds domain ETRA: Eastern Tropical Atlantic SATL: South Atlantic NAST(W) NAST(E) CNRY: Canary Current Coastal NATR WTRA ETRA Brazil Current SATL 14 voyages MN Colibri February 2006 to March 2009 11 voyages Monte Olivia July 2008 to March 2009
February cruises N. Atl. subtropical and tropical gyres NAST(E) NATR WTRA Atmosphere • Sink in NAST(E) • Influence of upwelling in NATR
July and August cruisesN. Atl. subtropical and tropical gyres NAST(E) NATR WTRA NATR NAST(E) • Source in NAST(E) • Source in NATR Atmosphere
Western tropical Atlantic (Monte Olivia track) WTRA SATL SEC NECC NAST(E) North-South gradient >2oN undersaturation (NECC) < 2oN sursaturation (SEC) NATR
WTRA: the NECC region February 2006,legs 1& 2 April 2007 June 2007 July 2008 August 2007 Cither February 1993, 7o30’N PLUMAND October 2007, 7o30’N Transit NECC August 2008, 7oN
Strong salinity control in the WTRA TA = 58.066 S + 264.914 r2 = 0.997 DIC = 50.59 S + 189.42 r2 = 0.988 Western tropical Atlantic (60oW-30oW, 0o-12oN) fCO2 = 15.66 (0.097) S – 161.175 (3.039) for S < 35 r2 = 0.92 Ternon et al., 2000: 11.72 (0.06) matm/ psu Körtzinger, 2003: 13.18 (0.06) matm/ psu
Eastward propagation of Amazon waters in the NECC Aug 2008 Oct. 2007 Assumption of conservative mixing of TA Amazon endmember (S=0): TAr = 265 mmol/ kg Ocean endmember (S=34.7): TAs = 2277 mmol/ kg r.TAr + s.TAs = TAobs r + s = 1
Conclusions and perspectives WTRA: Strong salinity control in the western tropical Atlantic but variability of fCO2 in the NECC still to be determined (CO2 sinks) Inflluence of the Amazon outflow, eastward propagation in NECC Assess the impact of the strength of the NECC, the Amazon outflow with a Regional Ocean Model (ROMS-PISCES) NATR and NAST(E): Sink of CO2 in winter to source in summer Influence of the Mauritanian upwelling in NATR: extent? Impact?