Download
1 / 16
160 likes | 168 Views
Estimating Bias of Satellite-Based Precipitation Estimates Relative to In Situ Measurements. Thomas Smith 1 Phillip A. Arkin 2 George J. Huffman 3 John J. Bates 1 1. NOAA/National Climatic Data Center/NESDIS 2. ESSIC, Univ. of Maryland, College Park

E N D
Estimating Bias of Satellite-Based Precipitation Estimates Relative to In Situ Measurements Thomas Smith1 Phillip A. Arkin2 George J. Huffman3 John J. Bates1 1. NOAA/National Climatic Data Center/NESDIS 2. ESSIC, Univ. of Maryland, College Park 3. Science Systems and Applications, Inc. and NASA Goddard Space Flight Center
Precipitation Bias • Bias adjustments are needed for satellite-based precipitation. • Bias Evaluations: estimates of satellite bias relative to gauge data. • Bias Uncertainty: how good are the bias estimates given the available gauges. • Oceanic Precipitation Bias: can satellite estimates be adjusted over oceans to minimize the bias.
Bias Evaluations • Bias = Satellite – Gauge difference. • Analysis of monthly differences using a large-scale optimum interpolation (OI). • Bias spatial scales are needed for analysis.
Bias Correlation Scales • Zonal Averages at each latitude. • Red: satellite bias w.r.t. gauges (land only). • Black: satellite to satellite difference scales (land and sea). • Scales are similar, mostly 1000 km +. • Use constant scales of 750 km in both directions, to minimize excessive spreading of bias.
Examples: Zonal Averages • 1996-2003 Bias typically a few mm/day. • OPI bias smallest. • SSMI combined and GPI biases have opposite signs, some annual cycle.
Examples: 1996-2003 Averages • Positive bias over central Africa. • Negative over east Asia and Hawaii. • Different sign biases may cancel when data are combined.
Differences that Bias Corrections Make • 1996-2003 Average uncorrected and corrected SSMIc. • Most regions show little difference. • Large differences over central Africa, N.W. North America.
Bias Uncertainty • How well can the OI analysis reflect the bias? (Input data 2.5o and monthly; OI uses data from 12.5o centered region.) • How does bias uncertainty change with the number of raw biases analyzed? • What is the bias uncertainty when there are no gauges in a region?
OI Relative Error • Set all raw biases = 1 and analyze, compute error change with n = number of raw biases. • An exponential function estimates the error as a function of n. Error n
RMS Bias • RMS Bias (RMSB) is the typical bias magnitude (no correction), from only near gauges, global. • RMS difference between each satellite and all other satellites (RMSDs, land + sea) is mostly comparable to RMSB. OPI and TOVS have lower bias than the others, which have similar magnitudes. RMSB (mm/day) computed using n≥ 20 for each satellite,1996-2003 and globally. SMMI RMSB is the same for all. The RMSD between each satellite and all other satellites is also shown. Satellite RMSB RMSDs OPI 0.9 2.0 AGPI 1.5 1.7 GPI 2.0 2.1 SSMI 1.8 2.0 SSMI/TOVS 1.5 1.8 TOVS 1.2 2.0
Bias Error from a Merged Analysis • Merged error depends on how correlated the biases are. • All uncorrelated: • All correlated: • Part correlated:
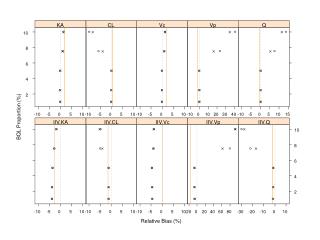
Bias Correlations • Measured spatial correlations from well-sampled regions (n≥ 20). • Negative correlations reduce bias error by canceling positive and negative errors. • Most have weak positive correlations (r usually < 0.5, some bias error reduction from use of multiple satellites).
Test: January 2000, all Satellites • Observed correlations, equal weighting for all 8 satellite estimates. • No bias analysis → no corrections (oceans). • More satellite coverage → less error (tropics).
High-Latitude Gauge Biases: Work in Progress • Bias errors from evaporation and blowing snow. They may offset each other, but they can also be as large as 30% of the mean (Groisman et al.). • Gauge adjustments are recommended for high latitudes. Uncertainty should be factored into bias uncertainty.
Oceanic Bias Adjustments: Work in Progress • No oceanic gauges except scattered islands, near coasts, and on some buoys. An oceanic low-bias estimate needed for adjustments. • TMI satellite estimates were found to have little bias compared to tropical Pacific buoys (Bowman et al. 2003). • Over oceans, Bias adjustment relative to TMI (or a satellite with least bias relative to TMI). Uncertainty from uncertainty estimate of TMI or of the satellite. • TMI limited in time (beginning 1998) and to between about 40ºS and 40ºN.
Summary and Conclusions • Using available data, satellite precipitation bias is evaluated near gauges. • Bias spatial scales are usually large (> 1000 km), but may be smaller near coasts. • Bias may be reduced by direct adjustment and by combining analyses with uncorrelated biases. • Oceanic estimates may be adjusted to a low-bias satellite estimate, such as TMI. • Because of uncertainties in the base analyses (gauges, TMI) the absolute bias is difficult to define. Adjustment is relative to a best estimate to minimize bias.