Download
1 / 12
120 likes | 262 Views
Inter-comparing high resolution satellite precipitation estimates at different scales. Phil Arkin and Matt Sapiano Cooperative Institute for Climate Studies (CICS), University of Maryland. HRPP Data. Most scientific and societal applications require fine spatial and temporal resolution

E N D
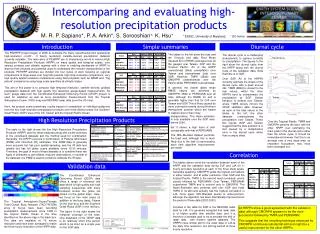
Inter-comparing high resolution satellite precipitation estimates at different scales Phil Arkin and Matt Sapiano Cooperative Institute for Climate Studies (CICS), University of Maryland
HRPP Data • Most scientific and societal applications require fine spatial and temporal resolution • Daily or finer • 10 – 50 km • In the past decade, new observations and research have made much higher resolution products possible, and extensive development and implementation has taken place • The products generally rely on innovative methods that combine geostationary IR observations/estimates with estimates from passive microwave observations • Time scales of about 3-hourly, spatial resolutions of 0.25°, near-global coverage (60°N-60°S) • Available at 3-hourly, 0.25º Resolution
HRPP Data used in this study Common resolution is 0.25˚, 3-hourly
Long record of sub-daily resolved gauges required: ARM Southern Great Plains (SGP - Oklahoma, Kansas - 16 gauges) TAO/TRITON Buoy array (Tropical Pacific - 24 gauges) Split buoys into 2 groups at 150W 2 undercatch corrections applied based on wind and threshold rate Compare nearest HRPP grid-point to high-resolution gauges Evaluate between Dec 2002 and March 2006 Require > 1 year of data; split SGP by 6 month season Estimate HRPP value as weighted average of nearest 4 grid-points to gauge Exclude buoy stations with probability of precipitation <0.1 Also include Stage IV radar in analysis of SGP Use as a benchmark for skill Validation data
US (SGP) 3-hrly Correlations Bias
Oceanic (TAO) 3-hrly Correlations Bias
Performance of GFS model data SGP • Satellite datasets limited by high noise • Models are improving and can provide useful data • GFS 12hr & 15hr forecast precip is obtained 4 times a day from March 2004 • High cors over SGP in warm season, v. low in cold season • V. low over tropical Pacific • Big diff between daily and 3hrly cors for GFS: indicative problems with diurnal cycle TAO
Large-scale comparison • These high resolution precipitation products are increasingly being used for climate purposes • Changes in extremes, the diurnal cycle, MJO etc • However, unclear whether they are suitable • Aggregate estimates to monthly, 2.5° resolution and compare with GPCP • Interested in finding artifacts: use EOFs and short-term linear trends • Some extra processing was required: removed data from 50-60° for GSMaP and PERSIANN to avoid erroneous, dominant signal here • Removed some data from NRL-Blended in early period and some ice-infected areas of PERSIANN
Short term trends • Short term trends calculated over common period (Jan 2003 - Dec 2006) • Simple linear regression with time as only factor • Not indicative of long-term trends • Signs of some erroneous trends in CMORPH, NRL-Blended and PERSIANN • As with EOFs, data boundaries seem to cause discontinuities
Summary and Conclusions • Satellite-based products all exhibit skill in correlation and bias • CMORPH has slight advantage over others • Bias correction of TMPA works well over land, but biases are comparable to others over ocean • In SGP, some seasonality in correlation is seen (but not as much as might have been expected) • Large positive bias in warm season for non-adjusted products • Satellite-based products uniformly underestimate relative to buoy gauges - implications for oceanic precipitation? • Large-scale inter-comparison is encouraging • All datasets do well at monthly scale, although some are better than others (reprocessing is very important) • Some datasets have minor issues around ice and at higher latitudes and there may be data boundaries associated with addition of AMSU etc. • Care is required!