Download
1 / 16
170 likes | 284 Views
Validation of Satellite Precipitation Estimates for Weather and Hydrological Applications. Beth Ebert BMRC, Melbourne, Australia. 3 rd IPWG Workshop / 3 rd APSATS, 23 October 2006, Melbourne. Satellite precipitation estimates -- what do we especially want to get right?.

E N D
Validation of Satellite Precipitation Estimates for Weather and Hydrological Applications Beth Ebert BMRC, Melbourne, Australia 3rd IPWG Workshop / 3rd APSATS, 23 October 2006, Melbourne
Satellite precipitation estimates -- what do we especially want to get right? Climatologists - mean bias NWP data assimilation (physical initialization) - rain location and type Hydrologists - rain volume Forecasters and emergency managers - rain location and maximum intensity
Short-term precipitation estimates • High spatial and temporal resolution desirable • Dynamic range required • Motion may be important for nowcasts • Can live with some bias in the estimates if it's not too great • Verification data need not be quite as accurate as for climate verification • Land-based rainfall generally of greater interest than ocean-based
Some truths about "truth" data • No existing measurement system adequately captures the high spatial and temporal variability of rainfall. • Errors in validation data artificially inflate errors in satellite precipitation estimates
Rain gauge observations AdvantagesDisadvantages True rain measurements May be unrepresentative of aerial value Verification results biased toward regions with high gauge density Most obs made once daily
TRMM PR Radar data AdvantagesDisadvantages Excellent spatial and Beamfilling, attenuation, temporal resolution overshoot, clutter, etc. Limited spatial extent
Rain gauge analyses AdvantagesDisadvantages Grid-scale quantities Smoothes actual rainfall Overcomes uneven values distribution of rain gauges
Verification strategy for satellite precipitation estimates Use (gauge-corrected) radar data for local instantaneous or very short-term estimates Use gauge or radar-gauge analysis for larger spatial and/or temporal estimates
Spatial verification methods • Visual ("eyeball") verification • Continuous statistics (RMS, correlation, bias, etc) • Categorical statistics (POD, FAR, etc.) - - - - - - - - - - - - - - - - - - - - - - - - - - - - - - - - - - - - - - - - - - - - - - - - - - - - - - - - - - - - - - • Scale decomposition methods • Entity-based methods "standard" "scientific" or "diagnostic"
Step 1: Visual ("eyeball") verification Visually compare maps of satellite estimates and observations Advantage: "A picture tells a thousand words…" Disadvantages: Labor intensive, not quantitative, subjective Verifies this attribute? Location Size Shape Mean value Maximum value Spatial variability Rozumalski, 2000
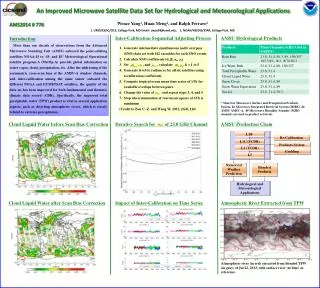
Time series of error statistics 24-hr rainfall from NRL Experimental Geostationary algorithm validated against Australian operational daily rain gauge analysis 0.25° grid boxes, tropics only
Continuous statistics Mean error (bias) Measures average error Mean absolute error Measures average magnitude of error Root mean square error Measures error magnitude, with large errors having a greater impact than in the MAE Measures correspondence between estimated spatial distribution and observed spatial distribution, independent of mean bias Correlation coefficient
Correct negatives Estimated yes no yes hits misses no false correct alarms negatives Misses Hits Observed False alarms Observed Estimated Categorical statistics
Categorical statistics Bias score Probability of Detection False Alarm Ratio Threat score (critical success index) Equitable threat score
Real-time verification example 24-hr rainfall from NRL Experimental Geostationary algorithm
Web links for satellite precipitation validation • IPWG validation of daily rainfall estimates over many regions - http://www.bom.gov.au/bmrc/SatRainVal/validation-intercomparison.html • Climate Rainfall Data Center (monthly validation, global) - http://rain.atmos.colostate.edu/CRDC/ • Program for the Evaluation of High Resolution Precipitation Products - http://essic.umd.edu/%7Emsapiano/PEHRPP/ • Validation of 6-hourly and daily Hydro-Estimator and other geostationary estimates over US - http://www.orbit.nesdis.noaa.gov/smcd/emb/ff/validation/validation.html • TOVAS validation of daily TRMM-based estimates over US - http://disc2.nascom.nasa.gov/Giovanni/tovas/rain.ipwg.shtml • Forecast verification – Issues, Methods, and FAQ - http://www.bom.gov.au/bmrc/wefor/staff/eee/verif/verif_web_page.html