Download
1 / 15
150 likes | 245 Views
The Second AKARI Conference: Legacy of AKARI: A Panoramic View of the Dusty Universe. The mid-infrared view of red-sequence galaxies. Jongwan Ko Yonsei Univ. Observatory/KASI Feb. 28, 2012. Introduction. Galaxy bimodality. Galaxy colors: bimodal red : little SF and early-type

E N D
The Second AKARI Conference:Legacy of AKARI: A Panoramic View of the Dusty Universe The mid-infrared view of red-sequence galaxies JongwanKo Yonsei Univ. Observatory/KASI Feb. 28, 2012
Introduction Galaxy bimodality • Galaxy colors: bimodal • red : little SF and early-type • blue: active SF and late-type • Optical red-sequence: • Blue Cloud enter the Red Sequence • via different SF quenching modes, and • they merge further in a number of dry • merging. Baldry et al. 2004 blueu-r color red Faber et al. 2007 U-B color stellar mass
Introduction Galaxy evolution • A possible picture: red, passive, early-type transition populations quenching of SF & morphological transformation blue, star-forming, late-type Blue galaxies enter the red-sequence in different ways at different masses and times! Many different galaxies in transition phase !
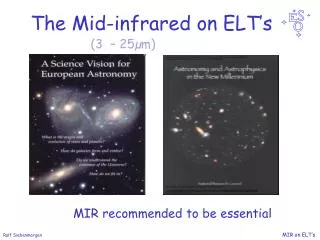
Introduction Why mid-IR? • Optical CMRs: • 1-2 Gyr after SF stopped, • galaxies redenough to join • the red sequence • SFR must remain low to stay there • NUV CMRs: • able to distinguish bet. • galaxies that have recent SF • within the last ~1 Gyr and • galaxies that have not. • large scatter in the NUV-optical • CMR for red ETGs • evidence of low-level recent SF! Kaviraj et al. 2007 g-r NUV-r • However, optical/NUV colors are sensitive to dust!
Introduction Why mid-IR? Bressan et al. 2006 • MIR emission correlates with PAH emission • Intermediate-age (> ~ 0.1 Gyr ) stars tracer: • MIR emission from ETGs (Bressan et al. 2006):most (13/17) ETGs show a significant broad emission • largely from the circumstellar dust around • AGB stars • MIR emission from AGB dust declines with time • MIR emission is sensitive to MIR-weighted mean • stellar ages PAH features Broad emission features • MIR can detect the presence of intermediate-age stars and small amounts of ongoing SF in the red-sequence!
Introduction Why mid-IR? Piovan et al. 2003 • Piovan AGB dust: • SSP models with accounting for circumstellar dust around AGB stars AGB dust MIR emission age sensitive trace past SF activity 11 & 15 μm provide an effective way to study MIR properties!
Data Sample: NEP Supercluster • 0.07 < z < 0.10 supercluster: • Data: NUV~MIR • Imaging: NUV (GALEX), optical (CFHT/Maidanak), NIR (KPNO), MIR (AKARI NEP-Wide survey & CLEVL) • Spectroscopy: MMT/Hectospec, WIYN/hydra, Lick/Kast, NED 1 cluster (A2255) from CLEVL 3 groups (X1, 10, 90) from NEP-Wide survey Mullis et al. 2001 Redshift dist. Spatial dist.
Results Optical / NUV / MIR CMRs • Optical red-sequence substantially larger scatters in the NUV and MIR CMRs B-R A2255 NEP-Wide NUV-R N3-S11
Results Optical / NUV / MIR CMRs • Optical red-sequence substantially larger scatters in the NUV and MIR CMRs • red : heterogeneous! • passively evolving old galaxies • recent SF insufficient to alter the • optical color • NUV flux is much sensitive to the • presence of younger stars • dust-obscured SF • S11 traces the MIR emission • arising from SF • Intermediate-age (> ~0.1 Gyr) stars • S11 traces broad MIR emission • from dust surrounding AGB stars B-R A2255 NEP-Wide NUV-R N3-S11
Results Dividing the red-sequence • Using MIR color (N3-S11) classification • MIR blue (N3-S11 < 0): Non-SF • MIR red (N3-S11 > 0): SF weak MIR-excess (N3-S11<-1): mean stellar age > 2-5 Gyr intermediate MIR-excess (-1<N3-S11<0): mean stellar age < 2-5 Gyr sSFR vs. N3-S11 color NEP-Wide A2255
Results Dividing the red-sequence • red-sequence galaxies divided into 4 classes: weak-MXGintermediate-MXGweak-SFGdusty-SFG passively evolving transitionphase star-forming
Results Environmental dependence of transition populations sSFR vs. local density red-sequence transition phase • Among massive ones (>1010 M⊙) • at outskirts of clusters, • ~70% galaxies are red due to • the higher proportion of • dusty-SFG and transition • galaxies • Galaxies in transition phase • are the most abundant (~40%) • SF-quenching and • morphological transformation • take place there fraction of each galaxy type vs. local density optical red optical blue outskirts cores
Summary • We have investigated the MIR properties of optical red-sequence • galaxies within a supercluster in the NEP region at z=0.087, using • AKARI NEP-Wide survey and CLEVL mission program. • AKARI N3-S11 (3-11um) color can be a good indicator of sSFRand the presence of intermediate-age stellar populations. • Red-sequence galaxies consist not only of passively evolving red ETGs, but also of (1) disk-dominated SF galaxies that have SFRs lower by ~4 times than blue-cloud galaxies and (2) bulge-dominated galaxies showing stronger MIR dust emission than normal red ETGs. • These two populations can be a set of transition galaxies from blue, SF, late-type galaxies evolving into red, quiescent, early-type ones. • Transition galaxies are typically found at the outskirts of galaxy clusters. • We need to precisely disentangle the origin of MIR excess emission!
Discussion Dividing the red-sequence “E+A” “UV-excess ETG” “Blue ETG” … Early-type morphology while experiencing recent SF “red spiral” “optically passive disk” “HI-deficient disk” … SF shutdown while retaining spiral morphology weak-SF MIR-excess ETG • blue, star-forming, late-type red, passive, early-type • quenching of SF & morphological transformation
Discussion NUV-excess and MIR-excess NUR-r vs. W1-W3 (3.4-12um) CCD for volume-limited and flux-limited (Mr<-21.5) galaxies which have little emission lines and place on the red-sequence