Download
1 / 24
240 likes | 375 Views
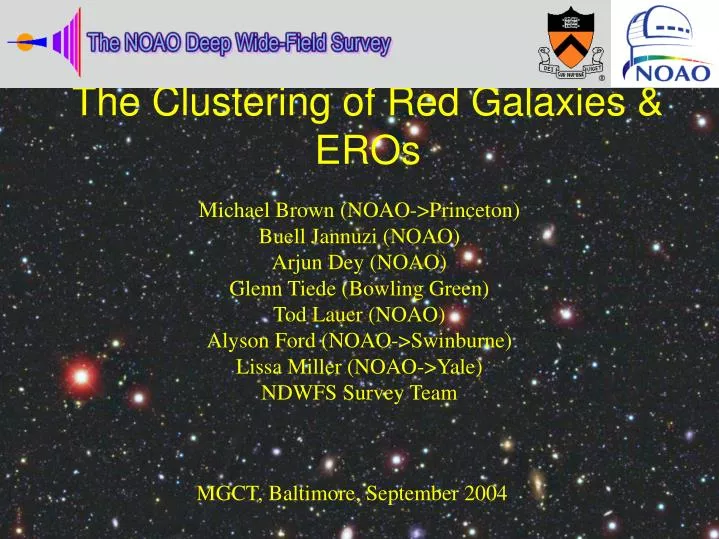
Michael Brown (NOAO->Princeton) Buell Jannuzi (NOAO) Arjun Dey (NOAO) Glenn Tiede (Bowling Green) Tod Lauer (NOAO) Alyson Ford (NOAO->Swinburne) Lissa Miller (NOAO->Yale) NDWFS Survey Team. The Clustering of Red Galaxies & EROs. MGCT, Baltimore, September 2004.

E N D
Michael Brown (NOAO->Princeton) Buell Jannuzi (NOAO) Arjun Dey (NOAO) Glenn Tiede (Bowling Green) Tod Lauer (NOAO) Alyson Ford (NOAO->Swinburne) Lissa Miller (NOAO->Yale) NDWFS Survey Team The Clustering of Red Galaxies & EROs MGCT, Baltimore, September 2004
Imaging of 18 square degrees with KPNO & CTIO telescopes. Limiting magnitudes of BW~26.5, R~25.5, I~25.0, & K~19.0. Comoving volume to z~5 is 0.3 Gpc3. 9 square degree BWRIK imaging data release on October 22. Imaging with Spitzer (IRAC+MIPS), Chandra, & GALEX. 4 to 10m spectroscopy including 10k Hectospec redshifts Two preliminary clustering studies : Red Galaxies and EROs.
z~0 z~0 z~2 evolve into Does or ? Kinematics of z>1 galaxies can have large uncertainties. Stellar masses of z>1 galaxies are uncertain. SED evolution of z>1 galaxies is uncertain.
Spatial clustering : Data and Models Stars ~3x10¹⁰ MSun Clustering Strength Bright L* Luminosity (BJ) Redshift
Flux limited samples mix redshifts, SEDs and luminosities. Galaxy clustering is a function of SED and luminosity at z~0. w(1')=0.024 g=1.81 Clustering strength Angular scale
Select galaxies as a function of restframe properties & epoch. Imaging surveys can cover large volumes to great depth. Requires accurate photometric redshifts. Use clustering to identify galaxies in massive DM halos. Connect galaxies populations as an evolutionary sequence. However, does clustering evolve as predicted by the models? Tracing galaxy evolution via clustering
How does clustering evolve? Smail et al. (2003)
Select the same galaxy population as a function of redshift. Select galaxies with comparatively slow SED evolution. Select galaxies with accurate photometric redshifts. Brown et al. (2003), ApJ, 597, 225. 5325 0.3<z<0.9 red galaxies from ~1 sq degree. Selected subsamples by luminosity, redshift and SED. Compared measured clustering with the models, 2dF & SDSS. How does galaxy clustering evolve?
Red galaxy apparent colours NDWFS PEGASE t Models LBGs FBGs
Red galaxy BWRI photometric zs Photometric Redshift Spectroscopic Redshift
Angular clustering Clustering strength ~L* Restframe BW-R>1.44 Angular scale
Redshift distributions Objects per unit redshift Redshift
Red galaxies at 0.3<z<0.9 NDWFS Spatial Clustering 2dF Evolution corrected luminosity
~L* red galaxies at 0.3<z<0.9 SDSS Spatial Clustering 2dF NDWFS Redshift
Brown et al. (2003), ApJ, 597, 225. Spatial clustering is correlated with luminosity (mass). Spatial clustering is weakly correlated with redshift. Spatial clustering is consistent with hierarchical models. The full survey area is required for robust tests of models. Next NDWFS data release is on October 22. Red galaxy clustering at 0.3<z<0.9
Brown et al. (2004), ApJ, submitted. EROs are presumed to be the progenitors of local ellipticals. Dusty starbursts and galaxies with “old” stellar populations. Extreme clustering? Possibly with r0>10 Mpc for <L*? 617 K<18.4 EROs selected from ~1 sq degree. Largest ERO sample size by 2x. Largest ERO volume by 4x. Extremely luminous galaxies, with L~3L*(z=0). R-K>5, z~1 Extremely Red Objects
Angular clustering Angular clustering Angular Scale
Extremely Red Objects Photometric Redshift Spectroscopic Redshift
Redshift distributions Objects per unit redshift Redshift
Red galaxies and K<18.4 EROs 3L* Red EROs LCDM Spatial Clustering 2dF SDSS Redshift
Are <L* EROs strongly clustered? Angular clustering at 1' K-band magnitude limit
Completed preliminary z<1.4 studies with ~1 sq degree. Galaxy clustering is a function of luminosity and mass. Galaxy clustering does not evolve rapidly with redshift. Observed clustering is consistent with hierarchical models. ERO clustering is strong, but not unusually strong. Larger area will robustly test hierarchical models. We will use galaxy clustering to measure galaxy evolution. Next imaging data release is 22 October 2004.