Download
1 / 26
270 likes | 358 Views
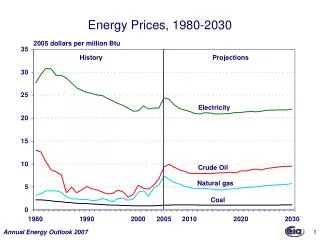
Higher Education: A Presentation to the Budget Trends Commission May 27, 2008 Mark Misukanis Director of Fiscal Policy and Research Office of Higher Education. Projected Change in Working Age Population (Age 25-64) by Race/Ethnicity, 2000-2030. 7%. 152%. 270%. 169%. 341%. 75%.

E N D
Higher Education:A Presentation to the Budget Trends Commission May 27, 2008 Mark MisukanisDirector of Fiscal Policy and ResearchOffice of Higher Education
Projected Change in Working Age Population (Age 25-64) by Race/Ethnicity, 2000-2030 7% 152% 270% 169% 341% 75% Source: Minnesota State Demographic Center
Projected Percent Minority by Age Group 2000-30 Source: Minnesota State Demographic Center
79.3 92.4 8.9 30.5 9.0 Educational Attainment and Rank Among States—Minnesota, 2000 (Percent) Source: U.S. Census Bureau, 2000 Census
Native American/AK Native Asian/Pacific Islander White African-American Hispanic/Latino Male Male Female Female Male Female Male Female Male Female 1.2 1.6 1.4 Top Country (Canada) 1.0 1.2 0.8 Top Country (Norway) 1.0 US Index = 0.77 US Index = 0.86 0.6 0.8 0.6 0.4 0.4 0.2 0.2 0.0 0.0 Minnesota Educational Attainment by Gender and Race/Ethnicity, Age 25-34—Indexed to Top Country Percent with Bachelor’s Degree or Higher Percent with Associate Degree or Higher Source: U.S. Census Bureau, Public Use Micro-data Samples (Based on 2000 Census); Organisation for Economic Co-operation and Development (OECD)
Minnesota High School Graduates1991-92 through 2014-15 Source: Minnesota State Demographer and Office of Higher Education
Net Migration by Degree Level and Age Group—Minnesota 22- to 29-Year-Olds 30- to 64-Year-Olds Less than High School High School Some College Associate Bachelor’s Graduate/Professional Total Source: U.S. Census Bureau, 2000 Census; 5% Public Use Micro-data Sample (PUMS) Files
Post Secondary Headcount Enrollment 1997-2006 Source: Office of Higher Education
Allocation of AppropriationsFY 2008-09 Biennium Source: Department of Finance
Higher Education Spendingas a Percent of the General Fund Source: Department of Finance: February 2008 Forecast
Minnesota State Colleges and Universities Revenue Components(000’s) Source: Integrated Postsecondary Education Data System
Minnesota State Colleges and UniversitiesTuition as a Share of Total Revenue Source: Integrated Postsecondary Education Data System
University of Minnesota Revenue Components(000’s) Source: Integrated Postsecondary Education Data System
University of Minnesota Tuition as a Share of Total Revenue Source: Integrated Postsecondary Education Data System
MnSCU Spending Patterns(000’s) Source: Integrated Postsecondary Education Data System
MnSCU Instructional Spendingas a Share of Total Source: Integrated Postsecondary Education Data System
U of M Spending Patterns(000’s) Source: Integrated Postsecondary Education Data System
U of M Instructional Spendingas a Share of Total Source: Integrated Postsecondary Education Data System
Net Price by Sector by Adjusted Gross Income Dependent Students Private Non-Profit Private For-Profit U of M MnSCU 4 year MnSCU 2 Year Source: Office of Higher Education
Student and Parent Saving • Minnesota 529 Plan : • Operating since 2001 • Current Assets of $625 million • Account Beneficiaries 48,058
Student Borrowing • In general, a larger percent of undergraduates in Minnesota had student loans than nationally, and Minnesota students borrowed more, on average, during the 2003-2004 academic year. • Among Minnesota undergraduates who attended full-time for the full academic year, 63 percent had student loans. • The average annual amount borrowed by all undergraduates was approximately $5,500. Full-time students who attended for the full academic year borrowed an average of $6,600 annually.
Student Borrowing (Continued) • Much of the recent increase in the percentage of students with loans occurred in the upper income brackets. In 2000, 28 percent of full-time, full-year dependent students in Minnesota coming from families with incomes of $90,000 or more had student loans while, in 2004, 57 percent of similar students had loans. • In Minnesota, full-time, dependent students whose parents belong to the middle income categories ($30,000-$89,999) were still more likely to borrow than those in the lowest or highest income categories. • In recent years, students have increased their reliance on “alternative” student loans from on-federal sources.
Accountability Goals • Goal 1:Improve success of all students, particularly students from groups traditionally underrepresented in higher education • Goal 2:Create a responsive system that produces graduates at all levels who meet the demands of the economy • Goal 3:Increase student learning and improve skill levels of students so they can compete effectively in the global marketplace • Goal 4:Contribute to the development of a state economy that is competitive in the global market through research, workforce training and other appropriate means • Goal 5:Provide access, affordability and choice to all students
Other Topics State Comparisons of Revenue per FTE Higher Education Production and Migration Source: SHEEO and NCHEMS
Future Budget Issues • High School Graduates and Preparation • The New Millennial Student • Faculty Retirements and Replacement • Workforce Supply • 5. Facility Utilization and Other Cost Issues
Mark Misukanis Director of Fiscal Policy and Research Minnesota Office of Higher Education Mark.Misukanis@state.mn.us