Download
1 / 1
10 likes | 114 Views
Figure 1. Figure 2. Equation 1. Figure 3. Figure 4. Short Bursts and Giant Flares

E N D
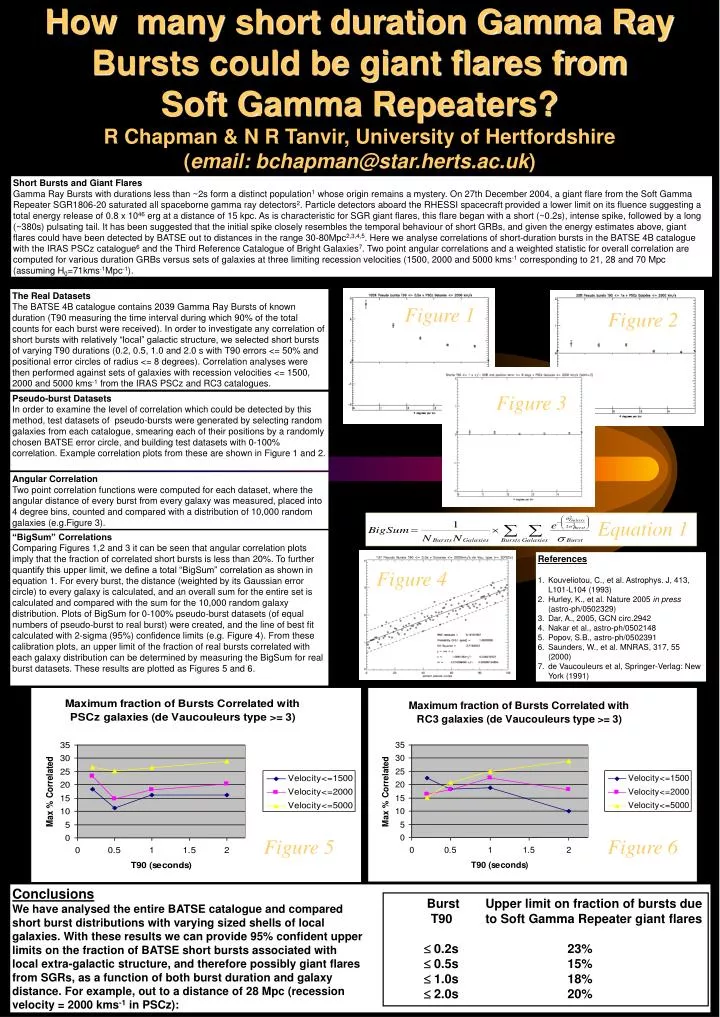
Figure 1 Figure 2 Equation 1 Figure 3 Figure 4 Short Bursts and Giant Flares Gamma Ray Bursts with durations less than ~2s form a distinct population1 whose origin remains a mystery. On 27th December 2004, a giant flare from the Soft Gamma Repeater SGR1806-20 saturated all spaceborne gamma ray detectors2. Particle detectors aboard the RHESSI spacecraft provided a lower limit on its fluence suggesting a total energy release of 0.8 x 1046 erg at a distance of 15 kpc. As is characteristic for SGR giant flares, this flare began with a short (~0.2s), intense spike, followed by a long (~380s) pulsating tail. It has been suggested that the initial spike closely resembles the temporal behaviour of short GRBs, and given the energy estimates above, giant flares could have been detected by BATSE out to distances in the range 30-80Mpc2,3,4,5. Here we analyse correlations of short-duration bursts in the BATSE 4B catalogue with the IRAS PSCz catalogue6 and the Third Reference Catalogue of Bright Galaxies7. Two point angular correlations and a weighted statistic for overall correlation are computed for various duration GRBs versus sets of galaxies at three limiting recession velocities (1500, 2000 and 5000 kms-1 corresponding to 21, 28 and 70 Mpc (assuming H0=71kms-1Mpc-1). How many short duration Gamma Ray Bursts could be giant flares fromSoft Gamma Repeaters?R Chapman & N R Tanvir, University of Hertfordshire(email: bchapman@star.herts.ac.uk) The Real Datasets The BATSE 4B catalogue contains 2039 Gamma Ray Bursts of known duration (T90 measuring the time interval during which 90% of the total counts for each burst were received). In order to investigate any correlation of short bursts with relatively “local” galactic structure, we selected short bursts of varying T90 durations (0.2, 0.5, 1.0 and 2.0 s with T90 errors <= 50% and positional error circles of radius <= 8 degrees). Correlation analyses were then performed against sets of galaxies with recession velocities <= 1500, 2000 and 5000 kms-1 from the IRAS PSCz and RC3 catalogues. Pseudo-burst Datasets In order to examine the level of correlation which could be detected by this method, test datasets of pseudo-bursts were generated by selecting random galaxies from each catalogue, smearing each of their positions by a randomly chosen BATSE error circle, and building test datasets with 0-100% correlation. Example correlation plots from these are shown in Figure 1 and 2. Angular Correlation Two point correlation functions were computed for each dataset, where the angular distance of every burst from every galaxy was measured, placed into 4 degree bins, counted and compared with a distribution of 10,000 random galaxies (e.g.Figure 3). “BigSum” Correlations Comparing Figures 1,2 and 3 it can be seen that angular correlation plots imply that the fraction of correlated short bursts is less than 20%. To further quantify this upper limit, we define a total “BigSum” correlation as shown in equation 1. For every burst, the distance (weighted by its Gaussian error circle) to every galaxy is calculated, and an overall sum for the entire set is calculated and compared with the sum for the 10,000 random galaxy distribution. Plots of BigSum for 0-100% pseudo-burst datasets (of equal numbers of pseudo-burst to real burst) were created, and the line of best fit calculated with 2-sigma (95%) confidence limits (e.g. Figure 4). From these calibration plots, an upper limit of the fraction of real bursts correlated with each galaxy distribution can be determined by measuring the BigSum for real burst datasets. These results are plotted as Figures 5 and 6. • References • Kouveliotou, C., et al. Astrophys. J, 413, L101-L104 (1993) • Hurley, K., et al. Nature 2005 in press (astro-ph/0502329) • Dar, A., 2005, GCN circ.2942 • Nakar et al., astro-ph/0502148 • Popov, S.B., astro-ph/0502391 • Saunders, W., et al. MNRAS, 317, 55 (2000) • de Vaucouleurs et al, Springer-Verlag: New York (1991) Figure 5 Figure 6 Conclusions We have analysed the entire BATSE catalogue and compared short burst distributions with varying sized shells of local galaxies. With these results we can provide 95% confident upper limits on the fraction of BATSE short bursts associated with local extra-galactic structure, and therefore possibly giant flares from SGRs, as a function of both burst duration and galaxy distance. For example, out to a distance of 28 Mpc (recession velocity = 2000 kms-1 in PSCz): Burst Upper limit on fraction of bursts due T90 to Soft Gamma Repeater giant flares 0.2s 23% 0.5s 15% 1.0s 18% 2.0s 20%