Download
1 / 19
190 likes | 195 Views
The Application of High Frequency Radar for Mapping Offshore Wind Resources. October 27, 2011 New Brunswick, NJ. Dr. Hugh Roarty. Rutgers University - Coastal Ocean Observation Lab. Vessels - Satellite. Satellite. CODAR. Ships/ Vessels. Glider. REMUS. Data Vis. Modeling. Security.

E N D
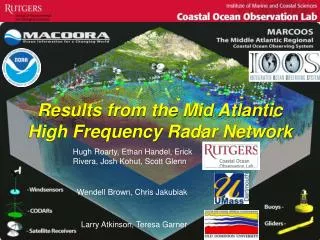
The Application of High Frequency Radar for Mapping Offshore Wind Resources October 27, 2011 New Brunswick, NJ Dr. Hugh Roarty
Rutgers University - Coastal Ocean Observation Lab Vessels - Satellite Satellite CODAR Ships/ Vessels Glider REMUS Data Vis. Modeling Security Leadership Education Glider Fleet HF Radar Network L-Band & X-Band Satellite Receivers 3-D Nowcasts & Forecasts
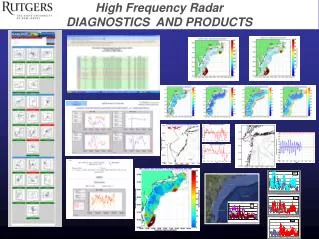
Components of a High Frequency (HF) RADAR system Computer and Monitor Transmitter Transmit Antenna Receiver Receive Antenna receive antenna monopole (A3) loop box (A1 & A2) radial whips Frequency Dependent Range, Resolution & Vessel Size electronics loop box loop 1 (A1) loop 2 (A2)
High Frequency Radar – Since 1996 14 Long-Range 7 Medium-Range 14 Short-Range 35 Total CODARs Corporate Partner: CODAR Ocean Sensors Nested Grids of Hourly Surface Current Maps ^ Combined CODAR & Satellite Products >
U.S. Coast Guard: Search And Rescue Optimal Planning System SAROPS Mid-Atlantic Operational Data Flow to SAROPS SAROPS User Interface SAROPS 96-Hour Search Area:HF Radar= 12,000 km2 SAROPS 96-Hour Search Area: HYCOM = 36,000 km2
Ecological Decision Support – Fisheries Divergent + Convergent Like Upwelling Our Approach: Develop statistical models using bottom trawl surveys and MARACOOS 3-D data to predict species distribution based on observed or forecasted MARACOOS 3-D fields. Hate Downwelling Downwelling Upwelling Downwelling Upwelling
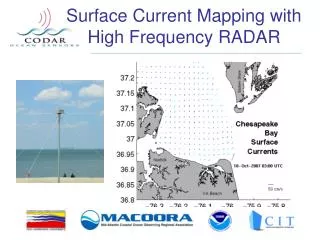
Water Quality – Nearshore Currents Alongshore Current Nearshore currents derived from single site radial currents track the movement of water quality constituents within 3 km of the beach.
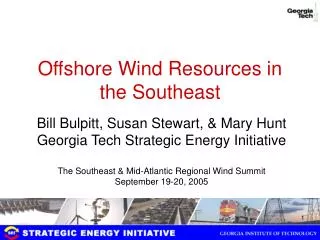
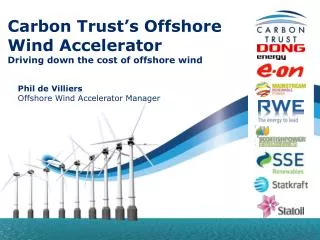
State of New Jersey New Jersey Board of Public Utilities (NJBPU) An Advanced Atmosphere/Ocean Assessment Program: Reducing the Risks Associated with Offshore Wind EnergyDevelopment As Defined by The NJ Energy Master Plan and The NJ Offshore Wind Energy Economic Development Act Principal Investigators:Scott Glenn, Sc.D. and Rich Dunk, Ph.D., CCM Team Members: Josh Kohut, Louis Bowers, Greg Seroka, John Kerfoot, Lisa Ojanen, Ethan Handel Hi-Res Weather Model Spatial Validation Data Wind Power Statistics
Future Medium Range Network13 MHz Range ~ 80 km Resolution 2 km
13 MHz Tx/Rx Antenna Single antenna at 13 MHz Transmit and Receive Radial whips no longer needed Possible to install with no guy wires and small base
Physics-based numerical computer model that provided preliminary estimates of the annual average wind using their proprietary MesoMap system.
HF Radar Derived Linear Wind Model Current Transient [U'] (cm/s) Wind Transient [W'] (cm/s) • Rotate wind vectors according to complex correlation • Calculate the slope and intercept of best fit line U'c(x,y,t) = slope(x,y)*W'(t)
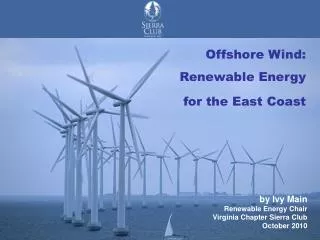
Ecological baseline studies of offshore wind power already performed • Avian species • Fisheries • Marine Mammals • Sea turtles • This project will perform physical baseline study
U.S. National HF Radar Network Data Flow Since 2007 2004 Plan Today’s Coverage 131 Radars
Conclusions • Rutgers is measuring the ocean 24/7 • HF Radar network can provide validation of atmospheric models and spatial maps of wind resource off NJ • Lessons learned from this project can be exported to the nation and the world