Download
1 / 15
160 likes | 360 Views
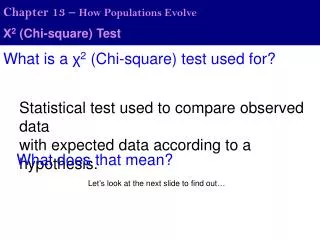
13.2 Chi-Square Test for Homogeneity & Independence. AP Statistics. Homogeneity.

E N D
13.2Chi-Square Test for Homogeneity & Independence AP Statistics
Homogeneity The two-sample procedures in Chapter 12 allow us to compare the proportion of successes in two groups. What if we want to compare more than two proportions? We’ll need a new test for that. If data is presented in a two-way table, we can look at categorical variables. The same test that compares multiple proportions also tests if those variables are related. This test is the X2 test for homogeneity/independence.
Example: Does Background Music Influence Wine Purchases? A study in a supermarket in Northern Ireland was conducted to determine whether or not the sales of wine changed relative to the type of background music that was played. Researchers recorded the amount and type of wine that was sold while Italian, French, and no music was played.
If music had no effect on the type of wine sold, we would expect to see similar distributions for each type of wine. Sketch the three wine distributions and compare: Music Wine
To compare the three population distributions, we must determine what counts we would expect to see if the three distributions were the same. To calculate the expected cell counts, we use the following formula…try to determine why? or….see page 747 expected count = Calculate the expected counts for each cell and enter them in parentheses next to the observed counts.
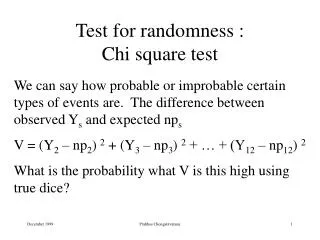
To test the significance of the difference between the observed and expected counts, we must calculate a X2 value. If this value is close to zero, then there is not much of a difference between the distributions. However, if this value is large, then we may have evidence that the distributions differ. H0 : p1 = p2 = p3 . The proportion of wine sold with eac type of music is the same vs. Ha : Not all are equal. over all cells in the table. Calculate this value. X2 = 18.2688
How likely was this observed difference? To calculate the p-value, we must look up our on the table. The degrees of freedom in a test for homogeneity is (row – 1)(column – 1). (3 – 1)(3 – 1) = 4 P-value =0.001093X2cdf(X2,1E99, df) Conclusion? There is significant evidence at α = 0.05 to reject the null hypothesis. It appears the distributions of wine sales may be different for each type of background music.
Independence In a sense, the Test for Homogeneity can be used to determine whether or not one categorical variable has an effect on another. If the goal of our analysis is to determine an association between two categorical variables, we call the test a Test for Independence. If one variable if affecting the other, then we would expect to see differences between the distributions of counts.
The null hypothesis vs. the alternative in a test for independence is Ho : There is no association between the two categorical variables Ha : There is an association between the two categorical variables
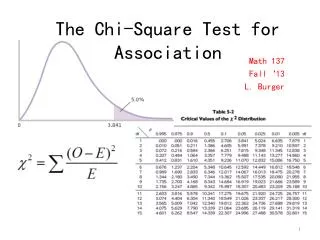
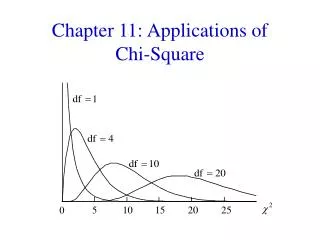
Chi-Square procedures can be used for a test of homogeneity or a test of independence if all expected counts are at least one and if 80% of the expected counts are greater than 5. If these conditions are met, the distribution of X2 will be Chi-Square with df = (r – 1)(c – 1).
Example: Smoking Habits—Students & ParentsHow are the smoking habits of students and parents related? Does a parent’s habits affect their child’s smoking habits? Consider the following data from eight high schools in Arizona and perform a test for independence:
Hypotheses: Ho : There is no association between parent and child smoking behavior Ha :There is an association between parent and child smoking behavior Conditions: Since we do not know if we have an SRS, we must proceed with caution. All expected counts are greater than 5. We will proceed with a X2 test of independence. Sampling Distribution of X2: df = (3 – 1)(2 – 1) = 2 x 1 = 2 X2 = 37.5663 p < α Reject Ho Conclusion: There is significant evidence to conclude there may be an association between parent and child smoking behavior (α = 0.05).
Example: Because of the stressful working environment, employees at Company X are prone to criminal activities. The following data represent the number of various types of crimes by gender in a random sample of 750 wayward employees at Company X. Does the evidence suggest that gender is independent of type of crime at a 0.05 significance level?
Ho: There is NO association between gender and type of crime. Ha: There is an association between gender and type of crime. We will assume we have an SRS. Since all expected counts are greater than 5, we will proceed with a X2 test for Independence. df = (4 – 1)(2 – 1) = 3 X2 = 0.9462 p > α do NOT reject Ho There is NOT significant evidence to suggest an association between gender and type of crime (α = 0.05).