Download
1 / 50
500 likes | 933 Views
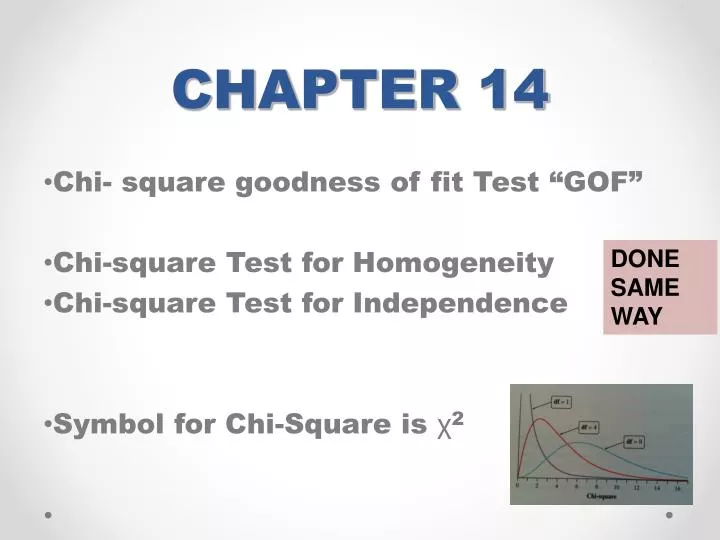
CHAPTER 14. Chi- square goodness of fit Test “ GOF †Chi-square Test for Homogeneity Chi-square Test for Independence Symbol for Chi-Square is χ 2. DONE SAME WAY. What ’ s the difference?. Goodness of Fit …..how well does the observed data match the expected….2 rows or 2 columns

E N D
CHAPTER 14 • Chi- square goodness of fit Test “GOF” • Chi-square Test for Homogeneity • Chi-square Test for Independence • Symbol for Chi-Square is χ2 DONE SAME WAY
What’s the difference? • Goodness of Fit…..how well does the observed data match the expected….2 rows or 2 columns • Homogeneity…..More than one sample is taken with one categorical variable in mind • (2+ Samples, 1 category) • Independence/Association…..Only one sample is taken and there are two or more categories. • (1 sample, 2+ categories)
Chi-Square Curve It is not a NORMAL CURVE!!! It is always skewed to the right some
Is your die fair—one more time. Roll your die 120 times. Write down the number for every roll.
Chi-Square GOF Test • If your die is fair you would expect to get 20 of each number in 120 rolls. • In this test we compare the EXPECTED results vs the OBSERVED results.
Hypotheses • Ho: The proportion of each number that occurs on my die is 1/6 • Ha: The proportion of each number that occurs on my die is different than 1/6 • There are no symbols for the chi-square. However, it is always one-sided, even though the word “different” is used.
Normal condition for χ2 • 80% of the expected cells are greater than or equal to 5. (not observed cells—expected cells!)
Degrees of Freedom (df) • For all chi-square tests use the following: • df = (r – 1)(c – 1) • r is the row and c is the column
Calculator steps TI-83+ Calculator Then hit 2nd and Stat Put your observed counts in L1 and Expected in L2 Tyoe the observed in L1 and expected in L2. Then click on the L3 heading and type the formula(then click enter), then quit out to the main screen Find the sum of L3, your answer is the chi-square statistic
Calculator steps After your get the sum you need to obtain the p-value X2 , UB , df This will give you the p-value
Calculator steps TI-84 calculator does most of the work for you Make sure you have typed your observed counts in L1 and expected counts in L2 5
Demographics. • Rancho is approximately 52% Hispanic, 27% Asian, 16% white and 5% other. • Does Mr. Pines’ AP stats classes reflect this diversity? Run the appropriate test, verify your requirements, and write a conclusion.
Referrals vs Days of week The table shows the number of students referred for disciplinary reasons to the principals office, broken down by day of the week. Are referrals related to the day of the week?
Chi-Square G.O.F. • Is the month that you are born uniformly distributed? • We can run a chi-square GOF based on the # of days in each month n = 129
H0: Births are uniformly distributed by the # of days in each month Ha: Births are not uniformly distributed by the # of days in each month CONDITIONS We have an independent sample of 129 students birth months. All births is obviously more than 10x our sample. 100% of our expected counts are 5 or more. df = 11 X2 = 7.75 P = .7355 This p-value is too high to reject Ho. There is not enough evidence to suggest that births are not uniformly distributed by the # of days in each month.
Chi-Square Test for Homogeneity • Data is given in a 2-way table • Expected counts are found by using a matrix on your calculator or by multiplying the (ROW TOTAL)(COLUMN TOTAL)/GRAND TOTAL • Conditions and df are the same as GOF test
Is there a difference…… • Do boys and girls prefer different video game consoles? • Please choose your favorite console out of the 3?
Hypotheses for Chi-Square Test for Homogeneity Remember Ha is always means different! Ho: There is no difference between gender and video game console preference Ha: There is a difference between gender and video game preference OR Ho: The proportions of boys and girls who prefer each type of console are the same Ha: The proportions of boys and girls who prefer each type of console are different
Why is this a Homogeneity Test? • Two samples were taken separately • Boys console preference • Girls console preference • There is ONE category of interest.
Two-Way Table 2013
Two-Way Table 2014
Quit to home screen, go to test menu Hit 2nd Matrix, go to EDIT Should be already setup if you used A and B Set the appropriate matrix size Enter observed counts in matrix
You need the expected counts….so go back to 2nd matrix. Use NAMES and go down to Matrix B, calculator generates them after you run the test You will most likely have to scroll to the right to see all of the expected counts REMEMBER!....EXPECTED COUNTS MUST BE ON YOUR PAPER!
College Students’ Drinking In 1987, a random sample of undergraduate students at Rutgers University was sent a questionnaire that asked about their alcohol drinking habits. Here are the results displayed in a two-way table.
Chi-Square Test for Independence There was one sample taken and then data was broken down into different categories. When only one sample is taken we are doing a Chi-Square Test for Independence/Association
Hypotheses This is a chi-square test for Independence/Association, you have a few options for writing the hypotheses Ho: There is no association between students’ residence type and drinking habits. Ha There is an association between students’ residence type and drinking habits. OR Ho: Student drinking habits and residence type are independent Ha Student drinking habits and residence type are not independent
Full Moon Some people believe that a full moon elicits unusual behavior in people. The table shows the number of arrests made in a small town during the weeks of six full moons and six other randomly selected weeks in the same year. Is there evidence of a difference in the types of illegal activity that takes place. This is a chi-square test for Homogeneity
Thanks To: Grace Montgomery
Testing M&M’s • The Mars company has always claimed that the color distribution of their M&M’s follow a certain proportion as follows: Check the M&M’s that were given to you. How many of each color do you have? We will run a Chi-Square GOF test to see if their claim is accurate. Do not eat your M&M’s until we have all observed and expected counts completed!
Hypotheses • Ho: My bag of M&M’s follow the same color distribution as the Mars company claim. • Ha: My bag of M&M’s follows a different color distribution as the Mars company claim.
Assumptions/Conditions • ___% of expected counts >5 • My bag of M&M’s can be considered an independent random sample of M&M’s
M&M Combined Results There were a total of 5606 M&M’s sampled. We have a chi-square statistic of 157.85 which gives a P-value of 0.
Mr. Pines Poker Chips • 44 white chips = 20pts • 5 blue chips = 30pts • 1 red chip = 50pts
Mr. Pines Poker Chips • 44 white chips = 20pts • 5 blue chips = 30pts • 1 red chip = 50pts There have been 135 attempts at randomly choosing poker chips out of the bag. A White chip has been pulled 105 times, a Blue chip 19 times, and the Red chip 11 times. Has this followed the expected probabilities? Can a Chi-Square GOF test be run? 80% of our expected counts must be at least 5. Need at least 250 attempts to meet our normal condition.
Baseball Bats • There have been some major bat changes for the 2011 season. Aluminum baseball bats have been regulated so that they meet certain safety standards. After 5 games this season, coach Pines has noticed significant reductions in power numbers such as 2B’s, 3B’s, and HR’s…..Of course he would like to test his hypothesis.
Baseball Bats • Run a Chi-Squared two-way table test to see if there is an association between the power numbers and types of bats. • Also run a 2-Prop. Z Test between the types of bats used. • If these are done correctly, Z2 = X2
Hypotheses • Ho: There is no association between type of bats and extra base hits • Ha: There is an association between type of bats and extra base hits
Assumptions/Conditions • E---All expected counts > 5 • S----We have a random sample of 23 schools hitting stats for the first 5 games of the 2010 and 2011 baseball seasons • I----We can assume that all stats are independent of other teams stats
X2 = 5.35 • P-value = .0207 • This p-value is low enough to reject at the 5% level. • There is evidence to suggest that there may be an association between the types of bats and extra base hits
Tootsie Pop Wrappers We are interested in whether or not the designs on the wrappings on Tootsie Roll Pops are independent of the flavor of the pop.
Hypotheses This is a chi-square test for Independence/Association, you have a few options for writing the hypotheses Ho: There is no association between pop flavor and designs on the wrapper. Ha There is an association between pop flavor and designs on the wrapper. OR Ho: Pop flavor and wrapper designs are independent. Ha Pop flavor and wrapper designs are not independent.